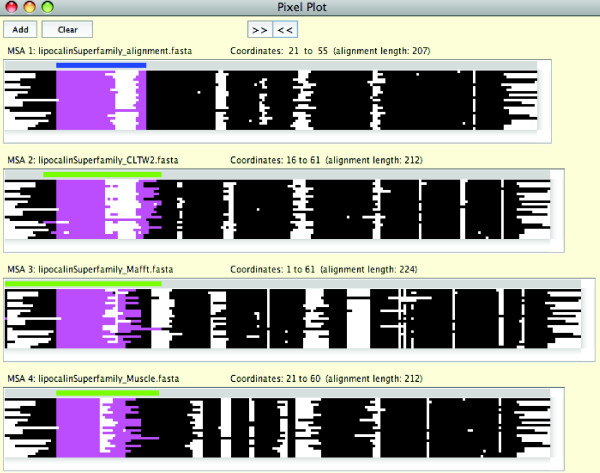
Figure 3.
The Pixel Plot. The Pixel Plot is used to compare the reference alignment of the lipocalin superfamily proteins (MSA 1) with MSAs reconstructed by three methods: ClustalW2 v2.1 (MSA 2), MAFFT v6.843 (MSA 3), and MUSCLE v3.8.31 (MSA 4). The blue selection bar is shown at the top of the reference alignment. The green range bar above each of the reconstructed alignments shows the column range that covers the sequence positions selected in the reference alignment. The areas highlighted in magenta under the selection and range bars in the alignments show the positions of the characters selected in the reference alignment.

