
Figure 2.
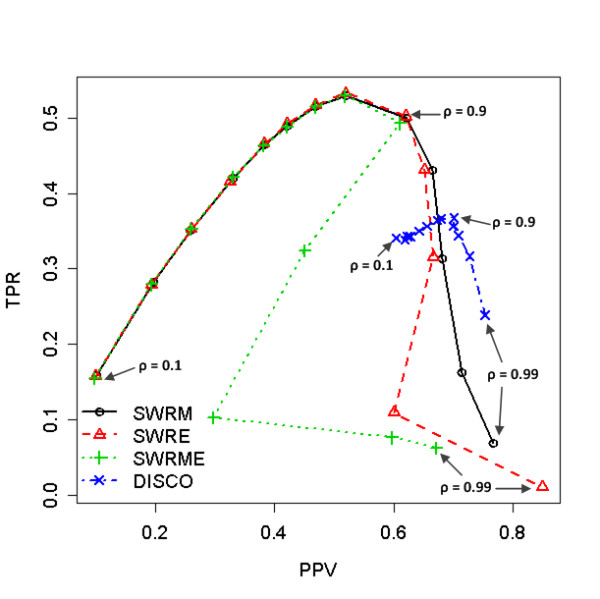
The effect of cut-off values, ρ, in case of homogeneous data (Spiked-in data). The true positive rates (TPR) versus the predictive positive values (PPV) are plotted. The performances of four different methods, SWRM, SWRE, SWRME, and DISCO, are compared according to the thirteen different values, (0.1, 0.2, 0.3, 0.4, 0.5, 0.6, 0.7, 0.8, 0.9, 0.93, 0.95, 0.97, 0.99). The maximum F1 scores are occurred at ρ = 0.9 for all the method.