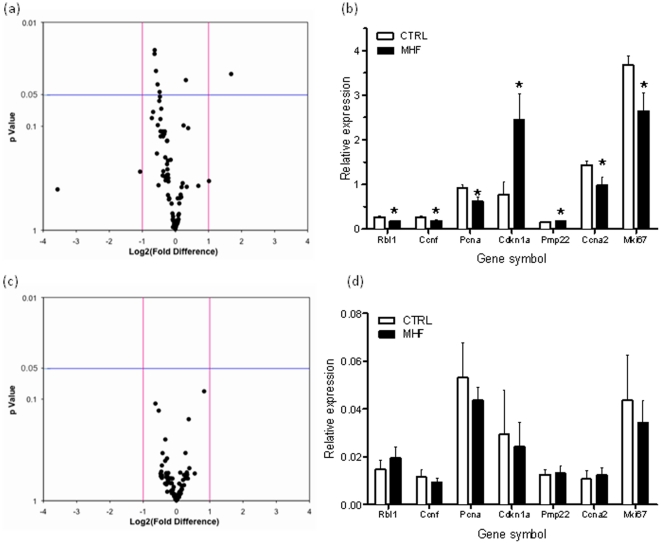
Figure 3. Cell cycle associated genes are differentially regulated as a consequence of maternal high fat diet.
(A) Volcano plot of relative gene expression (maternal high fat offspring relative to control) for 88 cell cycle associated genes in postnatal day 2 livers. Pink vertical lines indicate +/− two fold expression threshold. Blue horizontal bar represents statistical significance (P<0.05) threshold. (B) Significantly differentially expressed genes in P2 livers (C) Volcano plot for postnatal day 27 livers (D) Relative expression profiles at postnatal day 27 for the same genes shown to be significantly differentially expressed at postnatal day 2. CTRL, control offspring; MHF, maternal high fat offspring.

