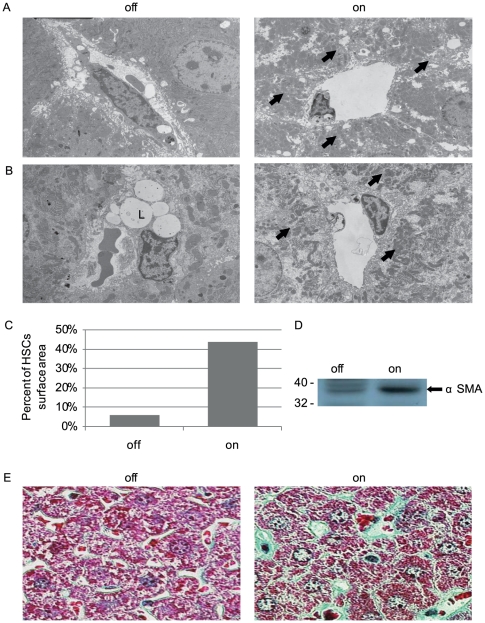
Figure 3. sVEGF-R1 expression in the adult liver causes activation of HSCs.
(a) Scanning electron microscopy of sinusoids in ‘off’ (a control littermate) vs. switch ‘on’ liver for one month showing prominent HSCs surrounding sinusoids (arrows) (b) Scanning electron microscopy showing transformation of HSCs from lipid droplets (L) containing cells (‘off’) to myofibroblasts like cells (arrows). (c) Quantification of the surface area of HSCs. ‘off’-5.8%, ‘on’ (sVEGF-R1 expression for one month)-43.7%. (d) Western blot analysis with anti α-smooth muscle actin antibody performed on liver extracts (e) Goldner staining for collagen fibers (green) indicating perisinusoidal accumulation of extra-cellular matrix.

