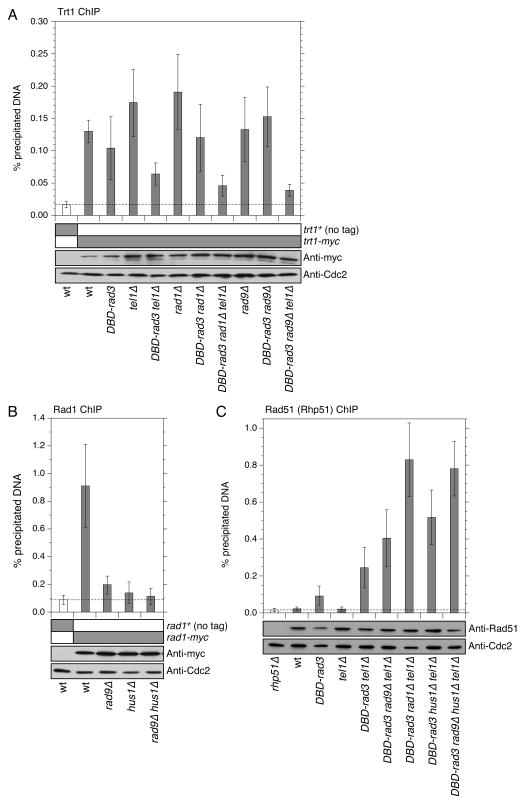
Figure 4.
Quantitative ChIP assays to monitor the recruitment of Trt1 (A), Rad1 (B) and Rad51 (Rhp51) (C) to telomeres for the indicated strains. Error bars represent standard deviation among at least three independent experiments. Expression levels for the indicated proteins were monitored by Western blot analysis, and Western blots with anti-Cdc2 served as loading controls. For (A), Trt1-myc showed statistically significant enrichment of telomeric DNA over no tag control for all strains tested (P < 0.015), while the difference in % precipitated (ppt.) telomeric DNA values between DBD-rad3 rad1Δ tel1Δ and DBD-rad3 rad9Δ tel1Δ was not statistically significant (P = 0.47). For (B), Rad1-myc showed statistically significant enrichment of telomeric DNA over no tag control for wild-type (wt) (P = 0.0010) and rad9Δ (P = 0.020) but not for hus1Δ (P = 0.30) and rad9Δ hus1Δ (P = 0.51). On the other hand, Rad1-myc ChIP analyses found no statistically significant differences among rad9Δ, hus1Δ and rad9Δ hus1Δ strains (P = 0.067 ∼ 0.60). For (C), Rhp51 showed statistically significant enrichment of telomeric DNA over rhp51Δ control for all strains tested (P < 0.0089), except wt (P = 0.54) and tel1Δ (P = 0.50) strains. In addition, % ppt. telomeric DNA values for DBD-rad3 tel1Δ rad1Δ cells showed statistically significant difference against DBD-rad3 tel1Δ (P = 0.00075), DBD-rad3 tel1Δ rad9Δ (P = 0.0044), DBD-rad3 tel1Δ hus1Δ (P = 0.013), but not against DBD-rad3 tel1Δ rad9Δ hus1Δ cells (P = 0.57) for Rhp51 ChIP.

