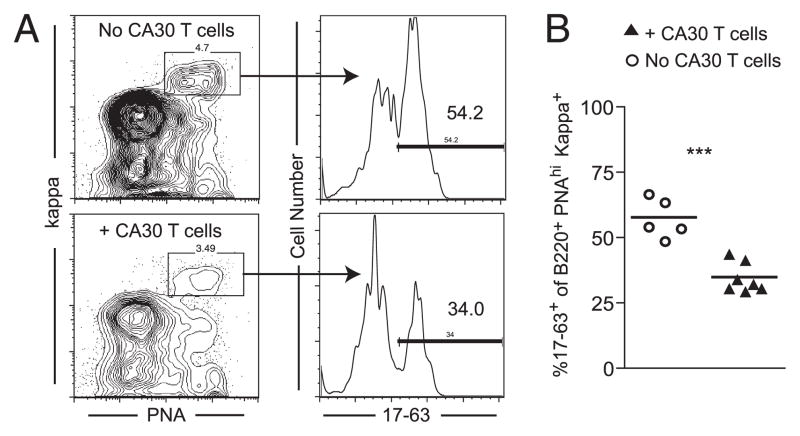
FIGURE 4.
CA30 T cells selectively inhibit development of κTg B cells in GC. A, Flow cytometric plot showing the gating strategy for the analysis of the proportion of κTg B cells, among all κ+ B cells, within GC or recipient mice. Mice received a 1:1 mixture of purified κTg κ−/− and A/J B cells on day 0. CA30 κ−/−cells were transferred to the experimental group on day 7. On day 10, B220+ splenocytes were gated for κ+ PNAhigh cells, and the percentage of these staining with mAb17-63 was determined. B, Quantification of the percentage of 17-63+ (κTg) B cells, among all κ+ cells, within the B220+ PNAhigh gate, as described in A. Symbols represent individual mice pooled from two independent experiments, with lines representing mean values. Statistically significant differences are indicated. See also Supplemental Fig. 2. ***p ≤ 0.001 as determined by a two-tailed t test.

