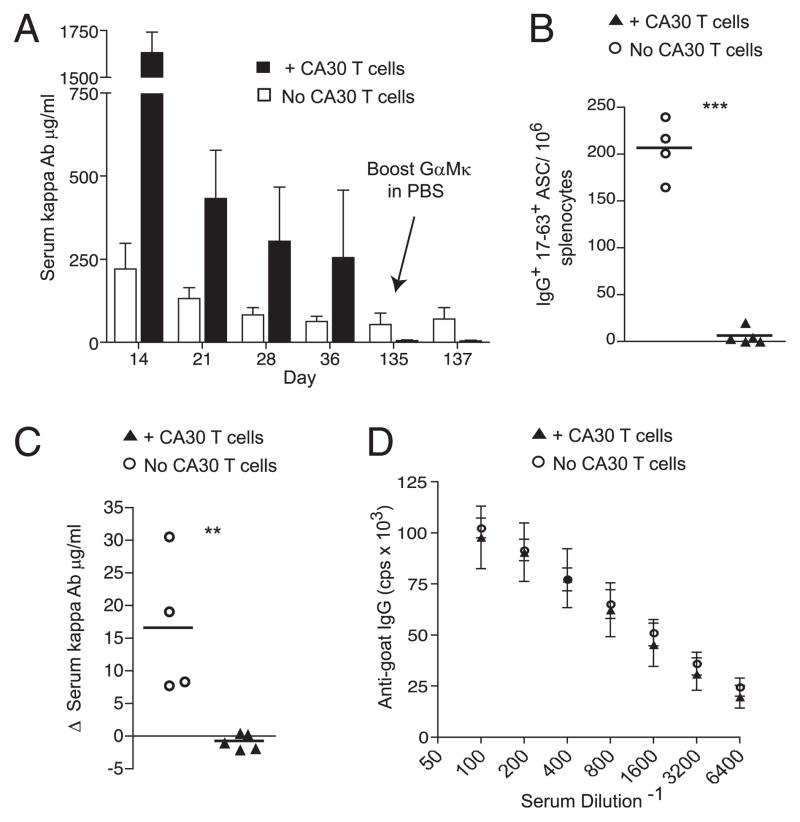
FIGURE 5.
Inhibition of a κTg memory response by CA30 T cells. A, Time course of serum κ+ Ab in mice that received (n = 5, ■) or did not receive (n = 4, □) CA30 κ−/− T cells on day 7. Tops of bars represent mean values for the group, with SEM shown. Note virtual absence of κ+ Ab in CA30 recipients at day 135 despite high titers on day 14. Data are representative of three independent experiments with three to five mice per group. B, Frequency of IgG1+ 17-63+ splenic ASC 50 h following boost. C, Change in serum κ+ Ab concentration 50 h following booster injection on day 135. B and C, Symbols represent individual mice, with lines representing mean values. Data are representative of three independent experiments with three to five mice per group. Statistically significant differences are indicated. **p ≤ 0.01, ***p ≤ 0.001 as determined by a two-tailed t test. D, Serum IgG+ Ab titers against goat IgG at 50 h after boost. Symbols represent mean values for each group (n = 5; +CA30 T cells; n = 4, No CA30 T cells) with SEM shown. Data are representative of three independent experiments.

