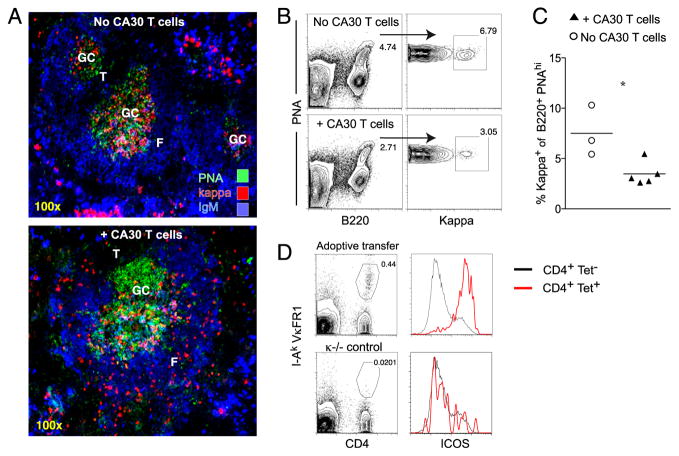
FIGURE 6.
GC development inhibited in recipients of small numbers of transferred cells. All mice received 5.0 × 10³ κTg splenocytes on day 0, followed by immunization with GαMκ in alum i.p. Mice in the experimental group received 5.0 × 10³ CA30 LN cells on day 6. Recipient spleens were collected on day 12. A, Representative images of day 12 splenic GC in experimental and control mice. B, Representative flow cytometric gating strategy of day 12 spleens for GC occupancy by κ+ cells. The percentage of κ+ cells among total B220+ PNAhigh splenocytes was determined. C, Quantification of the percentage of GC occupied by κ+ B cells on day 12 in mice that received (▲) or did not receive (○) CA30 LN cells, as described above. Symbols represent individual mice, with lines representing mean values. Statistically significant differences are indicated (*p ≤ 0.05, as determined by a two-tailed t test). D, Representative day 12 tetramer staining and ICOS expression of splenocytes in recipients of 5.0 × 10³ CA30 LN cells on day 6. Data in A–D are representative of two independent experiments with three to five mice per group.

