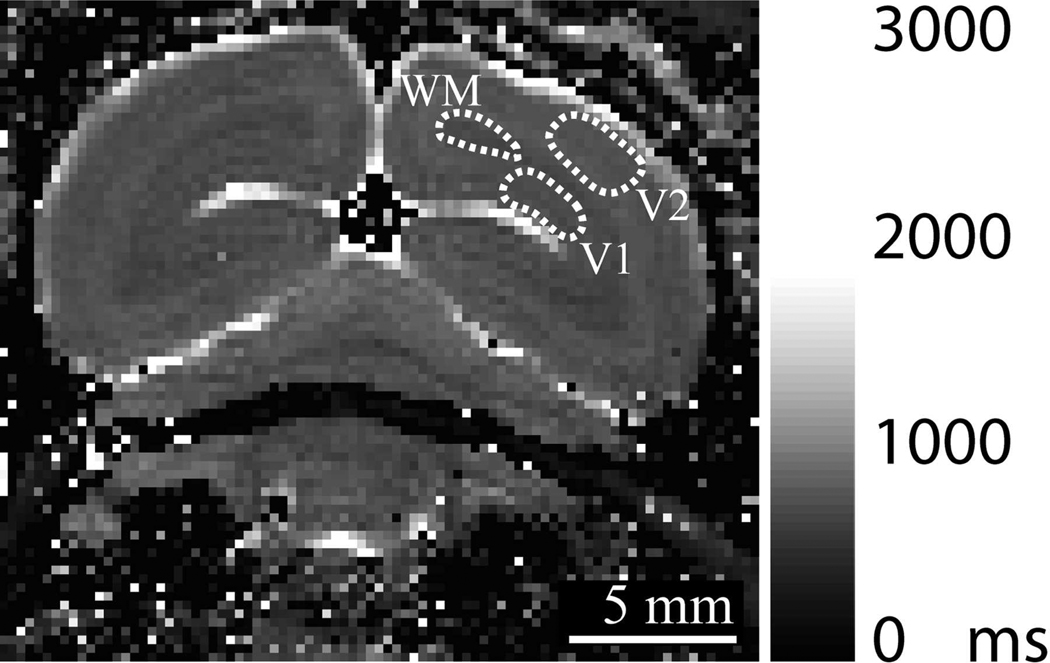
Figure 1.
A representative T1 map in a marmoset following four injections of 30 mg/kg MnCl2·4H2O showing the regions of interest (ROIs) used to measure the values in Table 1. (V1 = gray matter in V1, WM = white matter proximal to V1, V2 = gray matter in V2).

