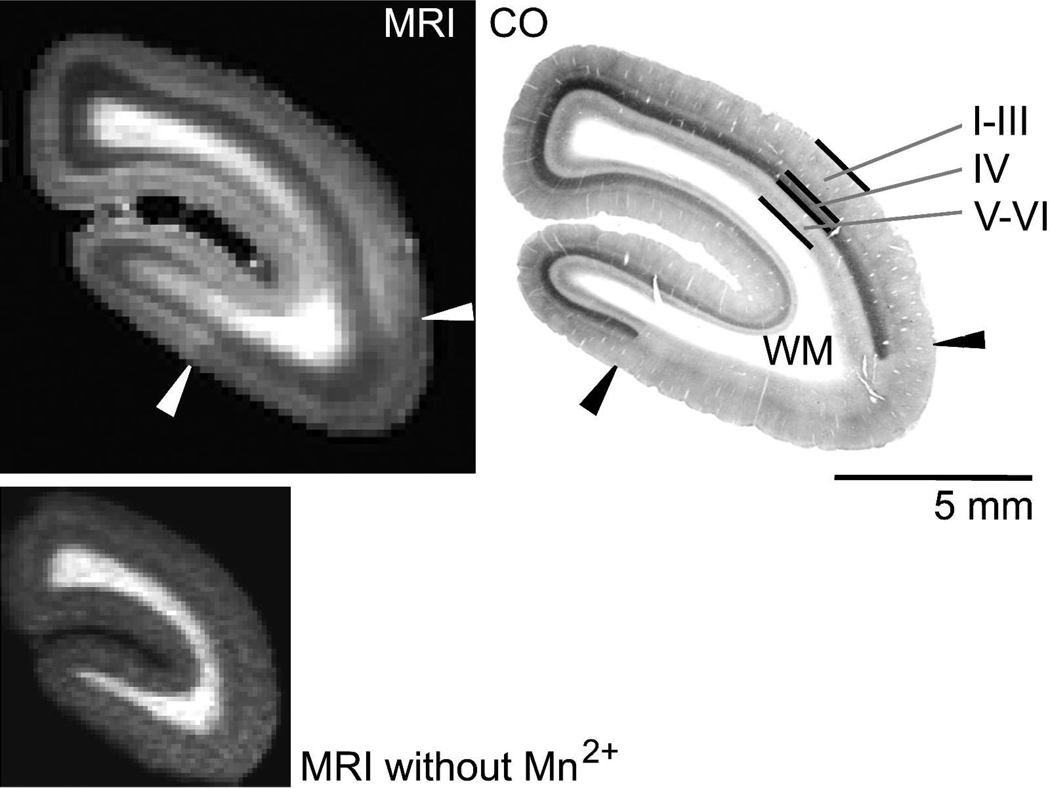
Figure 2.
A comparison of contrast in manganese-enhanced MRI in the marmoset occipital cortex versus staining for cytochrome oxidase (CO) activity. Upper Left: Slice from an in vivo T1-weighted coronal MRI in the occipital cortex of a marmoset following systemic injections of manganese. The in-plane image resolution and slice thickness are 167 µm. The cerebellum, brainstem, skull, and surrounding tissue have been masked in the MRI during post processing. The contrast to noise ratio (CNR) between V1 and V2 is 1.4 (CNR = magnitude signal intensity in V1 > magnitude signal intensity V2 / standard deviation of the noise in the image background). Lower Left: An image made prior to manganese injections using the same MP-RAGE pulse sequence, but with a shorter inversion time to maximize global image contrast in the presence of the longer, endogenous T1s. Upper Right: A corresponding 40 µm thick histological section stained for cyctochrome oxidase (CO) activity. (I–III, IV, V–VI denote cortical layers, WM = white matter). Note the strong staining in layer IV in the CO section that defines the extent of V1. The arrows denote the V1/V2 border. The T1 enhancement in the MRI corresponds to V1 identified on the CO section with the strongest layer-specific enhancement occurring in the location of layer IV.

