Figure 4.
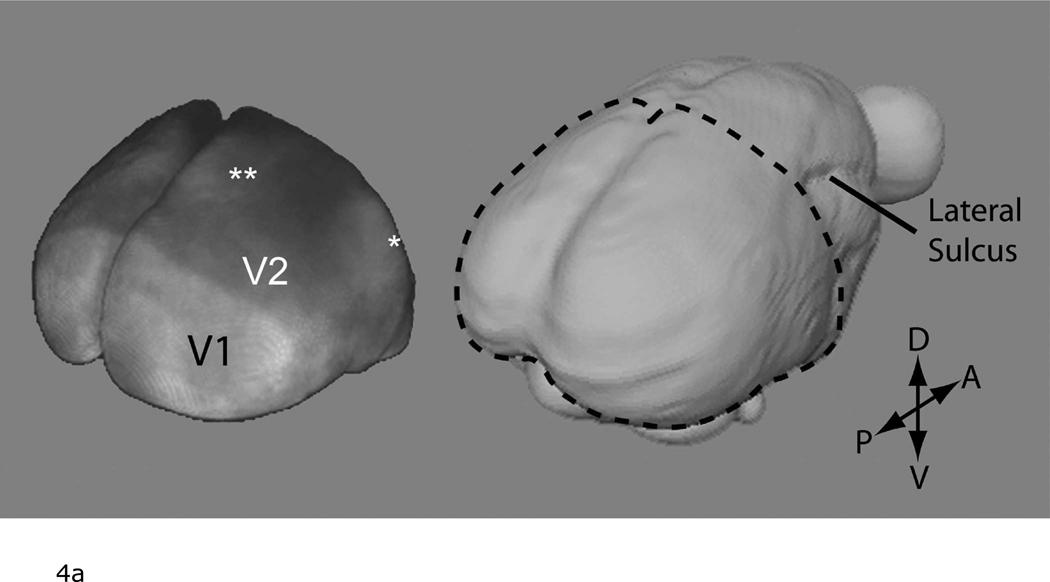
a: The V1/V2 border identified on the surface of the occipital cortex by manganese-enhanced MRI. Left: A volume rendering of a T1-weighted 3D MRI in a marmoset following systemic manganese injections. Note that the 3D MRI only covered the occipital cortex. The data is displayed using the >Voltex> rendering function in Amira. For this, the MRI volume was masked to only include cortical tissue. Each voxel in the the data volume was assumed to emit and absorb light. The amount of emitted light and the amount of absorption was determined from the MRI magnitude data by using a colormap. This image thus intuitively shows the strong T1 enhancement in V1. There is also lighter enhancement in regions corresponding to the location of the middle temporal (*) and dorsomedial (**) areas. Right: A surface rendering of the marmoset brain shown for localization. The dotted line shows the extent of the 3D image used to generate the Left figure. (P = posterior, A = anterior, D = dorsal, V = ventral).
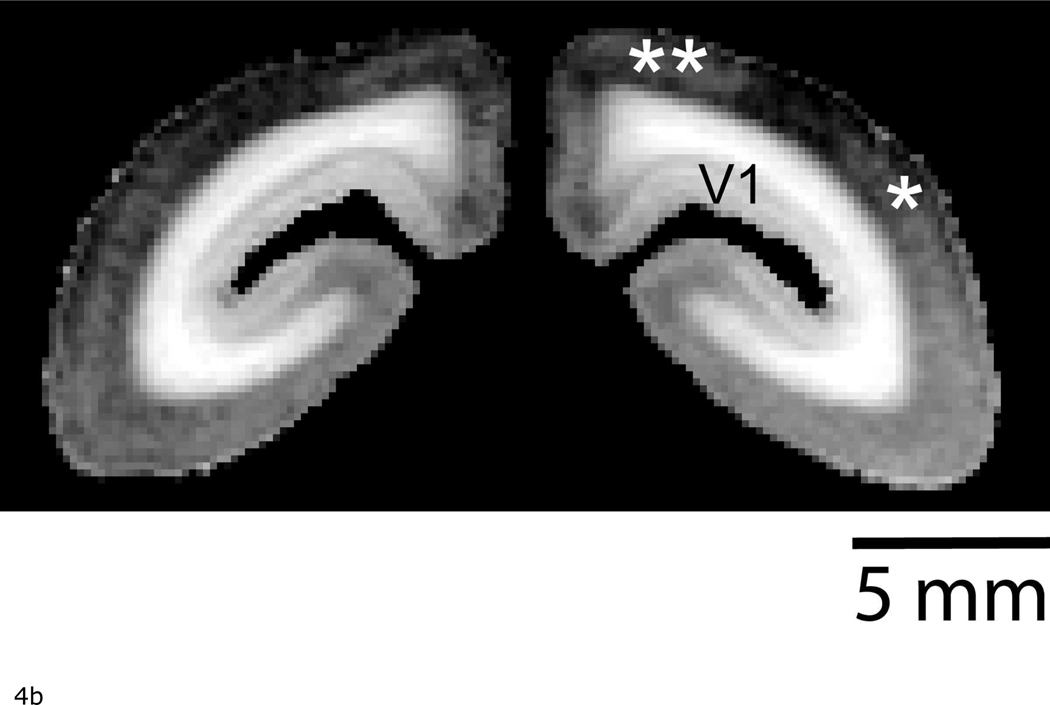
b: Coronal slice from the in vivo T1-weighted MR image used to created Figure 4a showing light enhancement in the middle temporal (*) and dorsomedial areas (**).


