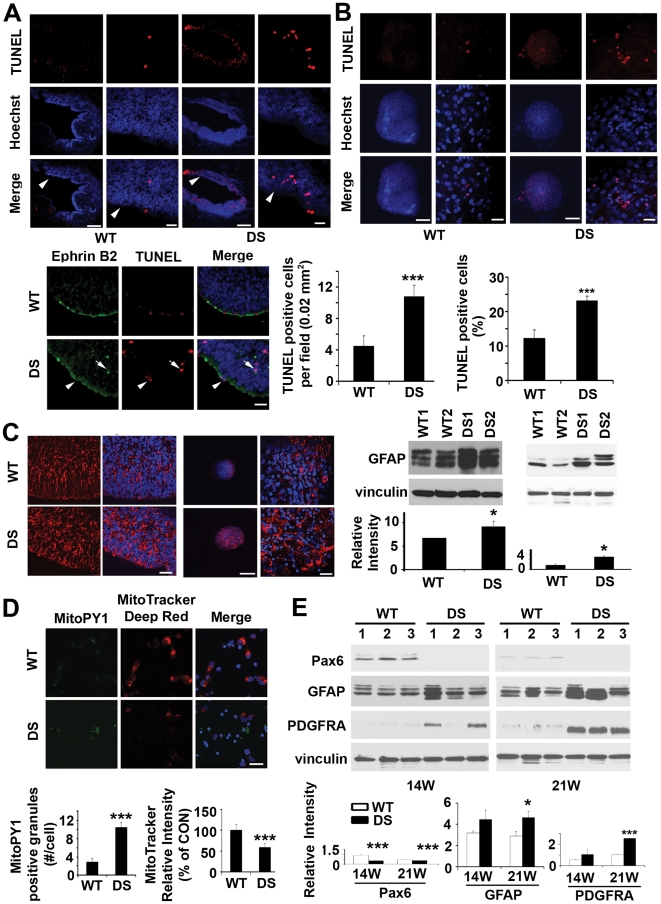
Figure 1. Increased apoptosis, gliosis, mitochondria dysfunction and gliocentric cell fate shift in DS HNPs.
(A) Confocal fluorescence photomicrographs demonstrate increased numbers of cells undergoing apoptosis as observed by TUNEL stain (rhodamine, counterstained with Hoechst 33342) along the VZ for DS fetal cortex (18W GA, noted by white arrowheads). Higher magnification images are to the right. The relative number of TUNEL labeled cells is quantified for both WT and DS VZ. (n = 4 for each). Many of the TUNEL positive cells (rhodamine) express the ephrinb2 neural progenitor marker (fluorescein) along the VZ of 18W GA fetal cortex (see white arrowheads in lower panel). (B) The increase in programmed progenitor cell death seen in vivo is also appreciated in vitro in human DS neurospheres after one week of culture. Quantification of TUNEL-positive cells is below (n>5 neurospheres in each experimental sample). (C) Fluorescent photomicrographs demonstrate increased intensity of immunostaining (rhodamine, counterstained with Hoechst 33342) for GFAP along the VZ of fetal 18W GA DS brain compared to normal age-matched controls. Western blot confirms the increase. The upregulation of GFAP (rhodamine) is also found in the DS neurospheres derived from the VZ of 18W GA fetuses after one week of culture, as shown by immunostaining and western blot. (D) Fluorescence photomicrographs by confocal microscopy demonstrate increased intracellular mitochondrial H2O2 production showed by MitoPY1 (fluorescein) staining and disrupted mitochondrial membrane potential showed by decreased MitoTracker deep red staining (rhodamine, counterstained with Hoechst 33342) within DS HNPs compared to WT controls (18W GA) after 24 hours of culture. MitoPY1 localizes to the mitochondria and directly assays H2O2 levels in the organelle. The quantification graphs are showed below. (E) Western blots demonstrate decreased neuroprogenitors shown by pax6 and increased glioprogenitors showed by GFAP and PDGFRA staining in human DS frontal cortex (n = 3 age-matched control and DS fetal tissues, 14W and 21W GA). Quantification is showed below. Scale bars are 200 µm for low magnification and 25 µm for high magnification in A, B and C, 25 µm for D. Data are represented as mean +/− STDEV, * p-value<0.05, ** p-value<0.01, *** p-value<0.001 by two tailed t-test.

