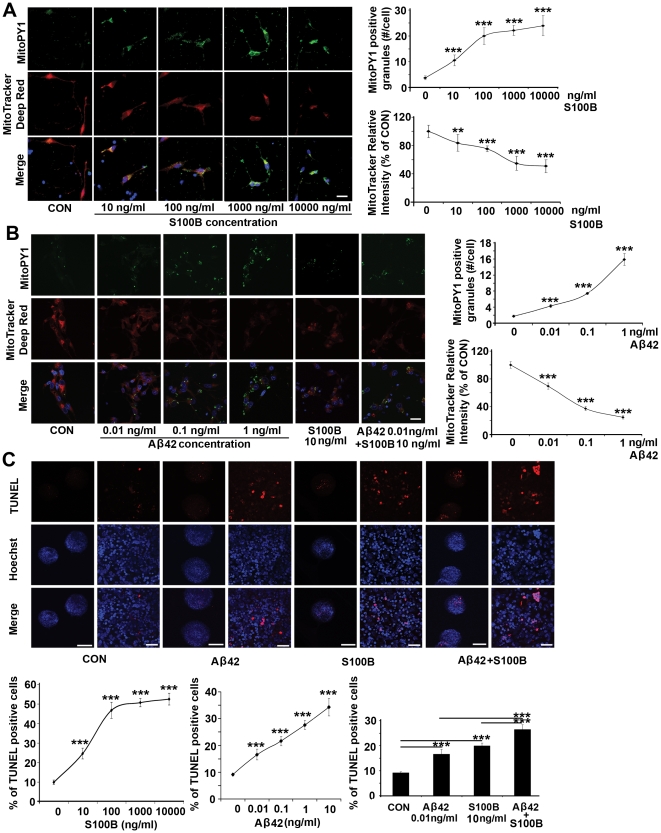
Figure 3. Soluble S100B or Aβ42 treatment promotes mitochondrial H2O2 production, loss in mitochondrial membrane potential and apoptosis in normal cultured HNPs.
(A) S100B exposure for 24 hours dose-dependently increases intracellular mitochondrial H2O2 production within HNPs, as shown by MitoPY1 (fluorescein, counterstained with Hoechst 33342) staining. MitoPY1 localizes to the mitochondria and directly assays H2O2 levels in the organelle. S100B treatment also leads to mitochondrial dysfunction in a dose-dependent fashion, as showed by decreased MitoTracker deep red staining (rhodamine). Results are quantified graphically to the right. (B) A similar trend of increased intracellular mitochondrial H2O2 and decreased mitochondrial membrane function appears after exposure to soluble Aβ42 for 24 hours. The quantification graphs for additive effects of S100B and Aβ42 are showed in Figure S3E. (C) Exposure to S100B or Aβ42 at concentrations comparable to that seen in DS HNPs for 24 hours causes apoptosis (showed by TUNEL staining) in WT cultured HNPs. The graphs below show a dose-dependent increase in apoptosis after S100B, APP or both S100B and APP stimulation (n>5 neurospheres in each experimental trial with at least 3 replicates). Scale bars are 25 µm for A and B; 200 µm for low magnification and 25 µm for high magnification in C; data are represented as mean +/− STDEV, *** p-value<0.001 by two tailed t-test and one-way ANOVA.

