
Figure 4. OCRL-1 localizes at the Golgi/TGN and in carriers budding from the TGN.
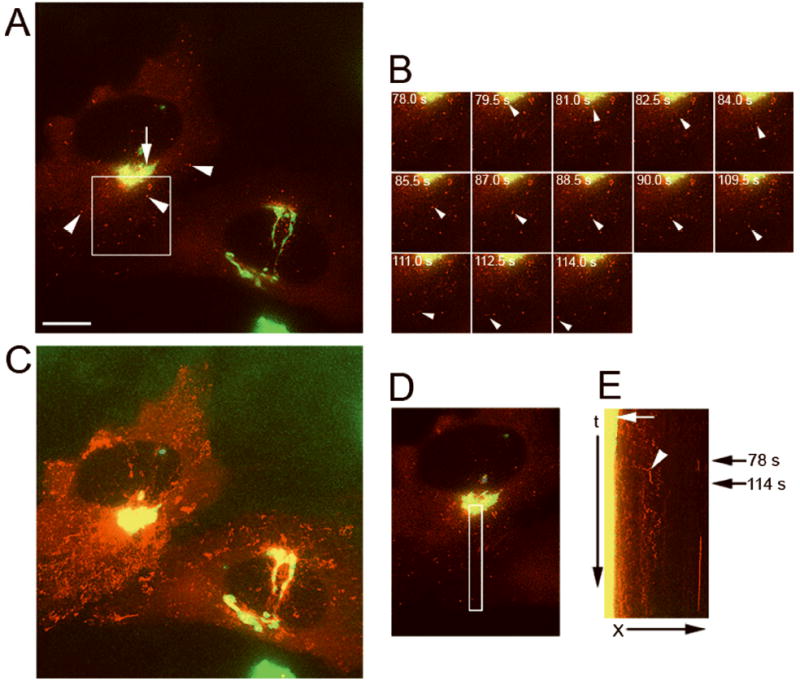
HeLa cells expressing both pGolgi-ECFP and OCRL-1-EYFP were analyzed by fluorescence microscopy. Images at two different emission wavelengths (465 ± 30 nm and 535 ± 30 nm) from the same field were collected every 2 s. to simultaneously visualize pGolgi-ECFP and OCRL-1-EYFP. A) Fluorescence distribution pattern. Red, OCRL-1-EYFP; green, pGolgi-ECFP; yellow, overlapping of OCRL-1-EYFP and pGolgi-ECFP. The arrow shows the colocalization of OCRL-1-EYFP and pGolgi at the Golgi/TGN, arrowheads point to small vesicles present throughout the cytoplasm containing only OCRL-1-EYFP. B) Individual frames of the area boxed in (A). A carrier containing OCRL-1-EYFP breaks up from the TGN and moves towards the cell periphery (white arrowheads). The time in seconds relative to the first image is shown in each frame. C) Maximum pixel projection. OCRL-1-EYFP and pGolgi-ECFP co-localized in the TGN but not in small vesicles present throughout the cytoplasm. D) Area where the events in B (carrier formation and movement to cell periphery) occurred is indicated by a white box. E) Kymograph analysis of the area defined in (D). A lack of movement of TGN compartments results in a vertical trace (yellow, white arrow). Several carriers containing OCRL-1-EYFP are formed in the TGN (red diagonal traces beginning in the yellow vertical trace). The trace that corresponds to carrier budding in (B) is indicated (white arrowhead). Black arrows on the right indicate the time when budding in (B) occurred. X, distance in μm; t, time in seconds. Bar, 10 μm.