
Figure 6. OCRL-1 carriers transport CD-MPR from TGN to endosomes.
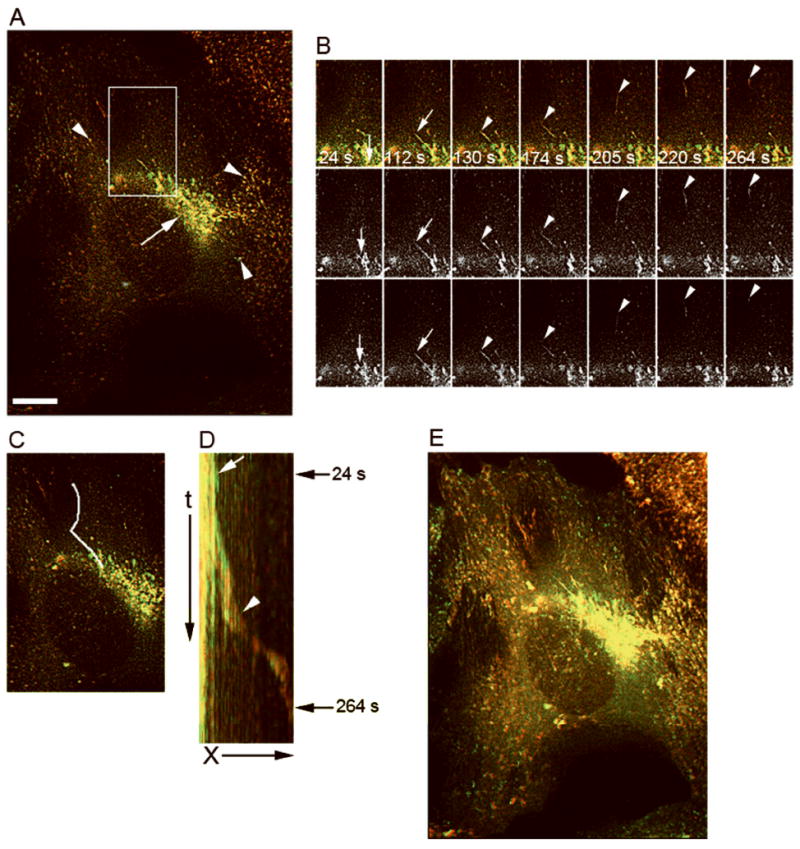
HeLa cells expressing CD-MPR-ECFP and OCRL-1-EYFP were analyzed by fluorescence microscopy. The formation and the transport of post-Golgi carriers were monitored by time-lapse fluorescence microscopy at 32° C. CD-MPR-ECFP and OCRL-1-EYFP were simultaneously visualized, images were collected every 1 s. A) Fluorescence pattern distribution; CD-MPR-ECFP (red), OCRL-1-EYFP (green) and overlapping of CD-MPR-ECFP and OCRL-1-EYFP (yellow). OCRL-1-ECFP and CD-MPR-ECFP colocalized at the TGN (arrow), and in endosomes present throughout the cytoplasm (arrowheads). B) Individual frames showing a TGN tubule that extends (white arrows), and breaks up to form a carrier containing both CD-MPR-ECFP and Rab31-EYFP (white arrowheads). Top panels: merged images; center panels: CD-MPR-ECFP; lower panels: OCRL-1-EYFP. Time relative to the first image is shown in seconds. C) Area where the events showed in B (carrier formation and movement to cell periphery) occurred is indicated by a white line. D) Kymograph analysis of the area defined in (C). A lack of movement of the TGN compartments results in a vertical trace (white arrow). Carrier formation and its movement along the area results in a diagonal trace that begins in the vertical trace (white arrowhead). Arrows at the right indicate the time where the budding showed in (B) occurred. E) Maximum pixel projection. OCRL-1-EYFP and CD-MPR-ECFP co-localized at the TGN and in small vesicles present throughout the cytoplasm X, distance in μm; t, time in seconds. (See animated movie Figure 6). Bar, 10 μm.