
Figure 7. OCRL-1 and newly synthesized CD63 are sorted to different carriers budding from the TGN.
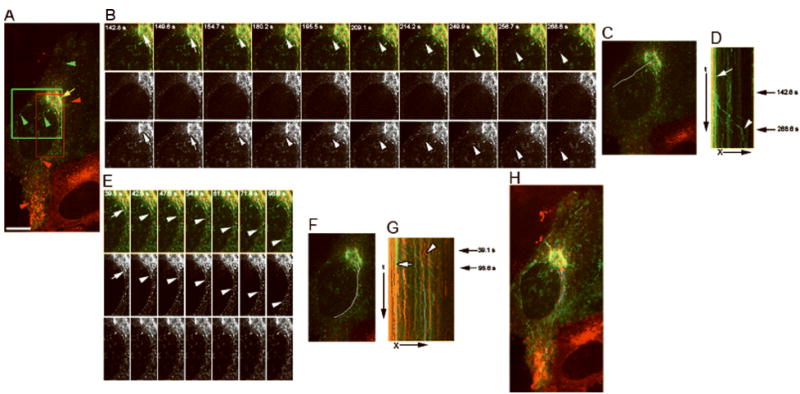
Stably-transfected Hela cells expressing OCRL-1-ECFP were injected intranuclearly with cDNAs encoding CD63-EYFP. Newly synthesized CD63-EYFP was trapped in the TGN and carrier formation visualized by time-lapse double fluorescence microscopy at 32° C. A) Fluorescence distribution pattern. Green, CD63-EYFP; red, OCRL-1-ECFP; yellow overlapping of CD63-EYFP and OCRL-1-ECFP. CD63-EYFP and OCRL-1-ECFP partially co-localized in the Golgi/TGN (arrow), but not in small vesicles present through out the cytoplasm (arrowheads). B) Individual frames of the area marked with green box in (A). Top panels: overlap of images; central panels: OCRL-1-ECFP; lower panel: CD63-EYFP. A TGN tubule containing CD63-EYFP extends (white arrows), and breaks up to form a carrier (white arrowheads). The time relative to the first image is shown in seconds. C) Area where the events showed in B occurred (carrier formation and their movement to cell periphery) is indicated by a white lane. D) Kymograph analysis of the area defined in (C). TGN, vertical traces (red and green lines, white arrow). The green trace that corresponds to the budding of carrier containing CD63-EYFP showed in (B) is indicated by a white arrow head. Black arrows on the right indicate the time where the budding showed in (B) occurred. E) Individual frames of the area marked with red box in (A). A TGN tubule containing CD63-EYFP extend (white arrow), and breaks up to form a carrier (white arrowheads). The time relative to the first image is shown in seconds. F) Area where the events showed in E occurred (carrier formation and its movement to cell periphery) is indicated by a white line. G) Kymograph analysis of the area defined in (F). The green line that corresponds to the TGN compartment from which the carrier was formed is indicated by a white arrow. The green trace that corresponds to the budding of carrier containing CD63-EYFP shown in (E) is indicated by a white arrowhead. Black arrows on the right indicate the time where the budding shown occurred. H) Maximum pixel projection. OCRL-1-EYFP and CD-MPR-ECFP co-localized in the TGN, but not in small vesicles present throughout the cytoplasm. X, distance in μm; t, time in sec. Bar, 10 μm.