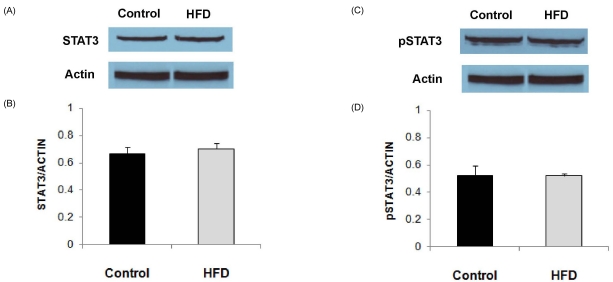
Fig. 3.
Expression levels of STAT3 and pSTAT3 in splenocytes from animals in the control and HFD groups stimulated with LPS (10 µg/mL). (A) Representative immunoblots of STAT3. (B) Densitometric analyses of STAT3 protein expression corrected for actin expression. (C) Representative immunoblots of pSTAT3. (D) Densitometric analyses of pSTAT3 protein expression corrected for actin expression. Values are means ± SEM (n = 4).

