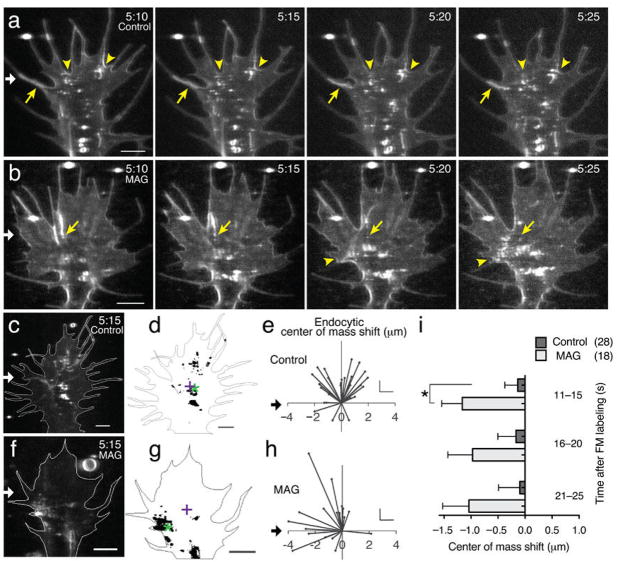
Figure 1. MAG-gradient stimulated asymmetric membrane internalization.
(a,b) A microscopic gradient of vehicle solution (a) or MAG (b) was applied to the growth cone of a Xenopus spinal neuron from a micropipette (200 μg/ml; white arrow) for the times indicated (min:s; see Methods). After a 5-min application, the surface membrane was labeled by a focal pulse of FM 5-95 (t= 5:00), which was delivered from a micropipette positioned directly in front of the growth cone leading edge. Time-lapse confocal images (t= 5:10–5:25) demonstrate rapid formation of large tubules (yellow static arrows) and hot spots of endocytosis (yellow arrowheads). See Supplementary Videos 1 and 6. Scale bars, 5 μm. (c,f) Representative confocal images show the spatial distribution of endocytosis 15 s post dye labeling and after stimulation (white arrow) with a control (c) or MAG (f) gradient for the time indicated (min:s). See Supplementary Video 7. Scale bars, 5 μm. (d,g) Binary images from (c,f) show the MAG-induced shift in center of endocytic activity (center of mass, green *) relative to the center of the growth cone (centroid, +). (e,h) Summary of endocytic center of mass shift as in (d,g), respectively. Trajectories depict the shift in endocytic center of mass for individual growth cones 15 s post-dye labeling. The origin is the center of each growth cone. Scales: x = 1 μm, y = 2 μm. (i) The average shift in the endocytic center of mass for all time points after FM-dye labeling (5-s bins). Data are the mean ± s.e.m. (n = 18, 28; * P < 0.05, Mann-Whitney U-test).

