
Figure 3. Polarized redistribution of ECM adhesion proteins by a MAG gradient.
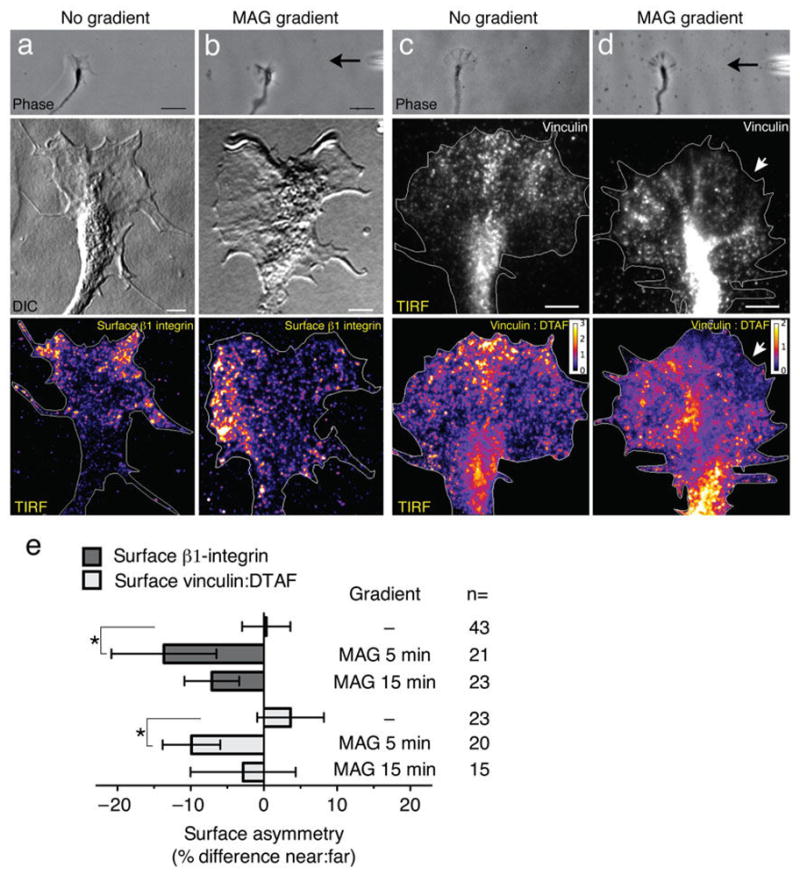
(a) A control untreated growth cone imaged live (top panel) or after fixation and immunolabeling for surface β1-integrin (middle and bottom panels). The pseudo-colored image shows a symmetric distribution of β1-integrin at the ventral surface membrane as detected by TIRF microscopy. (b) Representative images (as in a) of a growth cone treated with a MAG gradient (5 min, black arrow at right) show the laterally polarized distribution of surface β1-integrin. (c) Representative images of a control untreated growth cone (as in a) except immunolabeled for vinculin (middle and bottom panels). Dual-labeling with the amine-reactive flourescein DTAF controlled for changes in growth cone thickness and the pseudo-colored ratiometric image shows vinculin:total protein, with warm colors corresponding to a ratio > 1 (see look-up table). (d) Representative images of a MAG-gradient treated growth cone (5 min) immunolabeled for vinculin as in (c). The white arrows indicate the relative loss of vinculin labeling on the side of the growth cone facing the MAG gradient. Scale bars, 5 μm (top panels) and 20 μm (middle and bottom panels). (e) Summary of β1-integrin and vinculin asymmetry measurements. Surface is defined as the growth cone plasmalemma including the cytoplasmic face. Negative values indicate a loss in mean fluorescence intensity nearest the point source (see Supplementary Fig. 5e). Data are the mean ± s.e.m. (n = number of growth cones examined; * P < 0.05, bracketed comparisons; t-test).