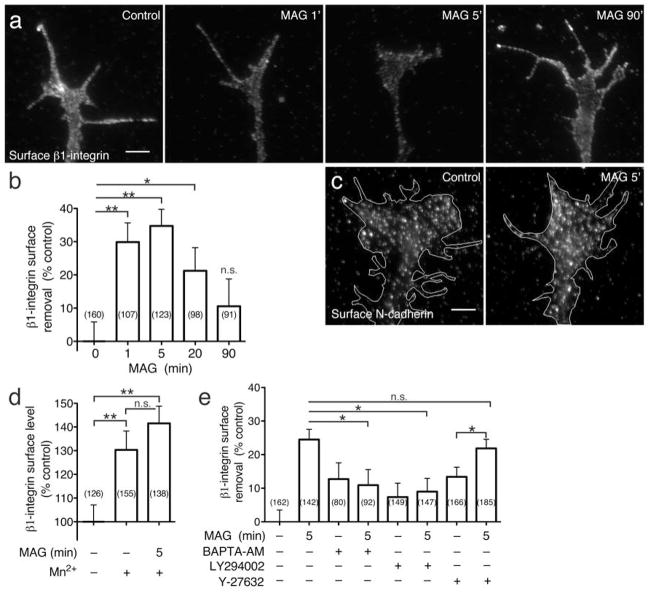
Figure 5. MAG- induced surface removal of β1-integrin.
(a) Representative fluorescence images show surface β1-integrin immunolabeling (see Methods) on growth cones treated with BSA vehicle (control) or following stimulation with MAG (1 μg/ml) for 1 (1’), 5 (5’), and 90 (90’) min. Scale bars, 5 μm. (b) Summary of β1-integrin surface removal in growth cones treated with MAG for the times indicated. For all surface removal measurements, mean fluorescence intensities of growth cones were normalized to vehicle-treated controls and are displayed as the percentage of surface fluorescence lost upon treatment. (c) Representative fluorescence images of surface N-cadherin on growth cones treated with vehicle (control) or MAG for 5 min (MAG 5’). (d) Summary of β1-integrin surface levels in growth cones treated with MAG (5 min) with or without pretreatment with Mn2+ (30 min; 1 mM). Mean fluorescence intensities of growth cones were normalized to vehicle-treated controls and are displayed as the percentage of surface fluorescence relative to control growth cones. (e) Summary of β1-integrin surface removal in the presence of inhibitors, as indicated. Intracellular Ca2+ was buffered by pre-loading neurons with BAPTA-AM prior to MAG treatment (see Methods). Pharmacological inhibitors to ROCK (Y-27632, 25 μM) and PI3K (LY294002, 3.33 μM) were added 30 min prior to MAG treatment. Data are the mean ± s.e.m. from 3 independent experiments; n = the number associated with each bar; * P < 0.05, ** P < 0.005, n.s. = no significant difference, bracketed comparisons, Mann-Whitney U-test.

