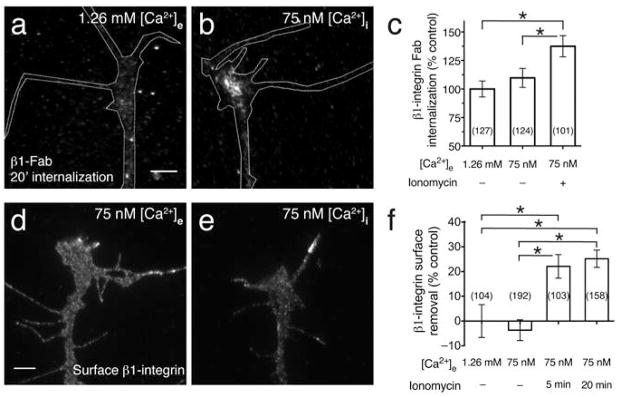
Figure 6. Cytoplasmic Ca2+ regulates endocytosis of β1-integrin.
(a) Fluorescence image shows β1 Fab internalization in a control growth cone in normal saline after treatment with DMSO vehicle alone (1.26 mM [Ca2+]e). Experiment was performed as in Fig. 2a. Scale bars, 5 μm. (b) Experiment carried out as in (a) but in the presence of low Ca2+-saline (75 nM [Ca2+]e). Low-amplitude [Ca2+]i signals were induced by treatment with ionomycin during the 20-min internalization period (5 nM; see Methods). (c) Summary of β1 Fab internalization measured by the mean fluorescence intensity of growth cones treated as indicated. Data for all graphs were normalized to the normal saline controls. (d) Representative fluorescence image shows surface β1-integrin immunolabeling on a control growth cone in low Ca2+-saline (75 nM [Ca2+]e) treated with DMSO vehicle (5 min). (e) Experiment carried out as in (d) except that ionomycin was added for 5 min (75 nM [Ca2+]i) prior to fixation. (f) Summary of β1-integrin surface removal in growth cones treated as indicated. Data are the mean ± s.e.m. from 3 (c) or 2 (f) independent experiments (n = the number associated with each bar; * P < 0.05, bracketed comparisons, Mann-Whitney U-test).

