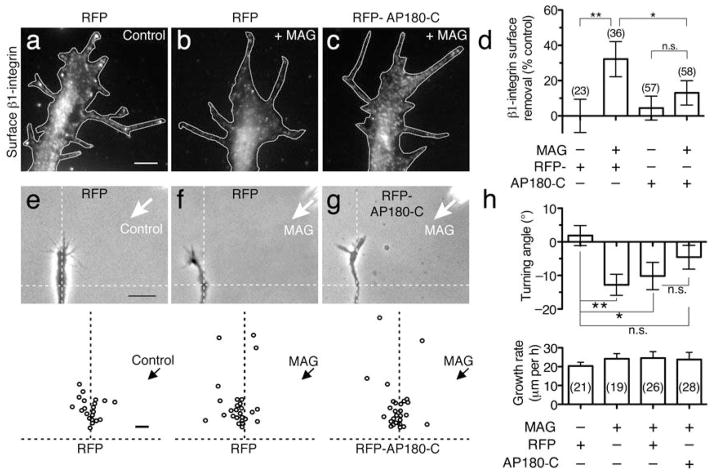
Figure 7. MAG-induced surface removal of β1-integrin and repulsion require clathrin-mediated endocytosis.
(a–c) Representative fluorescence images show surface β1-integrin immunolabeling on growth cones expressing RFP (a, b) or RFP-AP180-C (c) after treatment with BSA vehicle (a) or MAG (1 μg/ml) for 5 min (b, c). Scale bar, 5 μm. (d) Summary of β1-integrin surface removal in RFP- or RFP-AP180-C-expressing growth cones treated with BSA vehicle or MAG as indicated. Bars represent the mean fluorescence intensity for each group normalized to vehicle-treated RFP-expressing control growth cones. (e–g) Phase images of representative growth cones expressing RFP (e, f) or RFP-AP180-C (g) at the end of a 1-hr application of a BSA vehicle gradient (e; control) or MAG gradient (f, g; 150 μg/ml in the pipette). Dashed lines overlaid on the phase images indicate the position and orientation of the growth cone at the onset of the turning assay. Scatter plots depict the end points of individual growth cone extension relative to the starting position (origin) for all neurons examined. The original direction of growth was vertical and the arrow indicates the direction of the gradient. Scale bars, 20 μm (phase images) and 10 μm (plots). (h) Summary of turning angles and growth rates for all conditions. Data are the mean ± s.e.m. from at least 2 independent experiments (n = the number associated with each bar; * P < 0.05, ** P < 0.01, n.s. = no significant difference, bracketed comparisons, Mann-Whitney U-test). For comparison of the mean turning angles between groups treated with a MAG gradient: RFP- vs. RFP-AP180-C-, P = 0.21; and nonexpressing vs. RFP-AP180-C-, P = 0.09.

