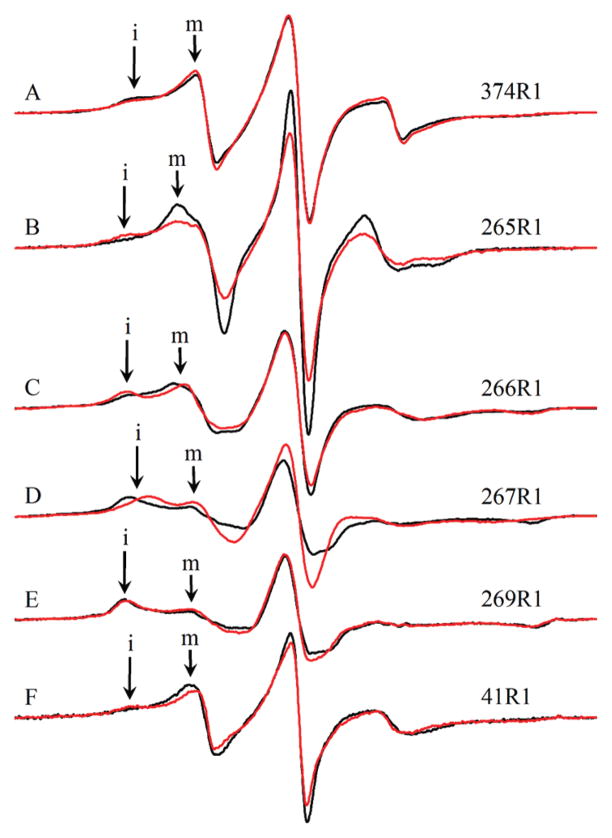
Figure 5.
EPR spectra of singly labeled yeast F-actin wild type and actin double mutants in the presence and absence of cofilin: (A) wild-type yeast F-actin (374R1), (B) 265R1, (C) 266R1, (D) 267R1, (E) 269R1, and (F) 41R1. Black spectra are those of F-actin. Red spectra are those of F-actin in the presence of an equimolar amount of yeast cofilin. “i” denotes the immobile component of each spectrum, where labeled. “m” denotes the mobile component of each spectrum, where labeled. The displayed field range is 100 G. All spectra are normalized for area.

