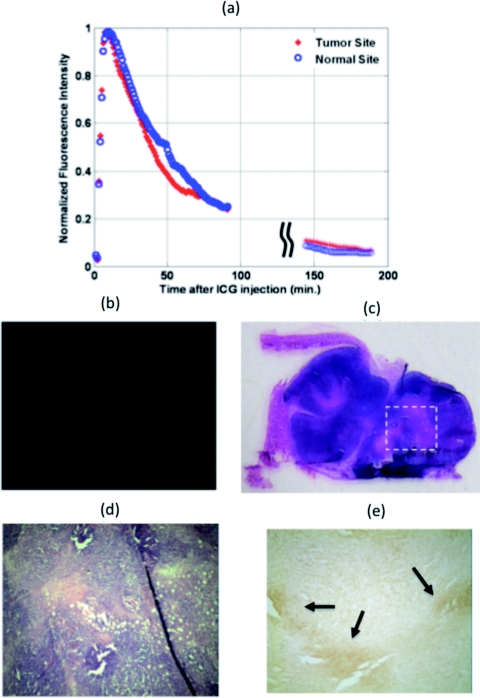
Figure 2.
Mouse injected with ICG and tumor size of 10 mm×5 mm. (a) Fluorescence signal measured from both the tumor and normal sites. (b) Fluorescence image acquired with Li-COR scanner. (c) Corresponding H&E stain. (d) 40×H&E of the marked region in (c). (e) Corresponding 40×immuno-histochemistry stain (brown) for tumor hypoxia.

