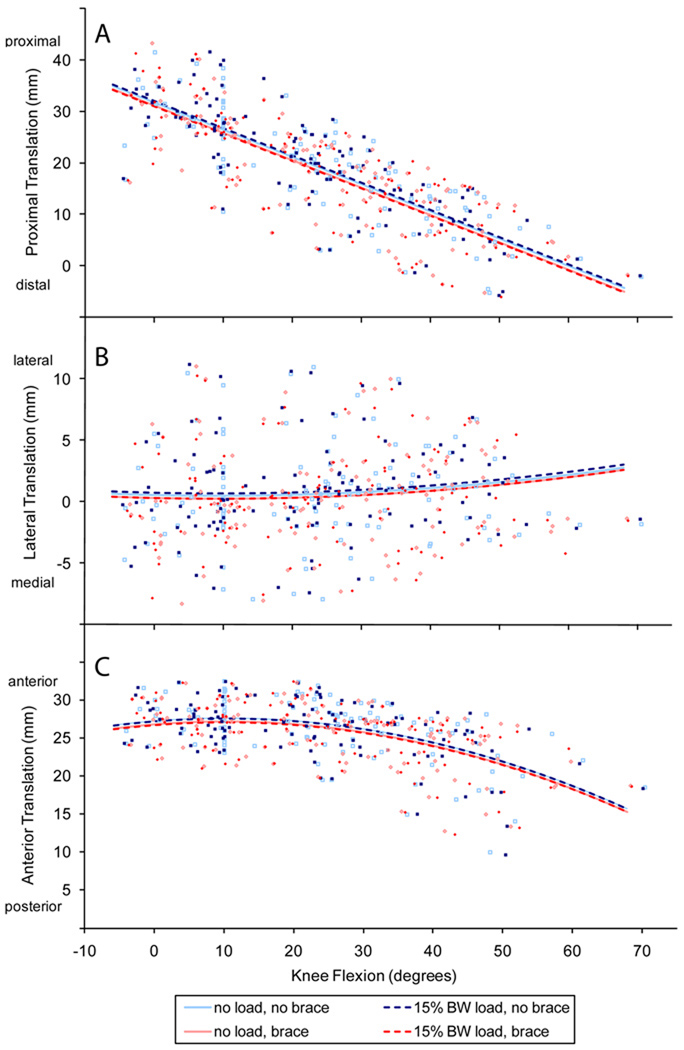
Figure 5.
Translation results as a function of knee flexion for a) proximal, b) lateral and c) anterior translation. The lines indicate the results of the hierarchical linear random-effects model for each condition 1) no load, no brace, 2) 15% BW load, no brace, 3) no load, with brace, 4) 15% BW load, with brace. The raw data points are included and are colored according to condition. The data were scaled to 10° of knee flexion.

