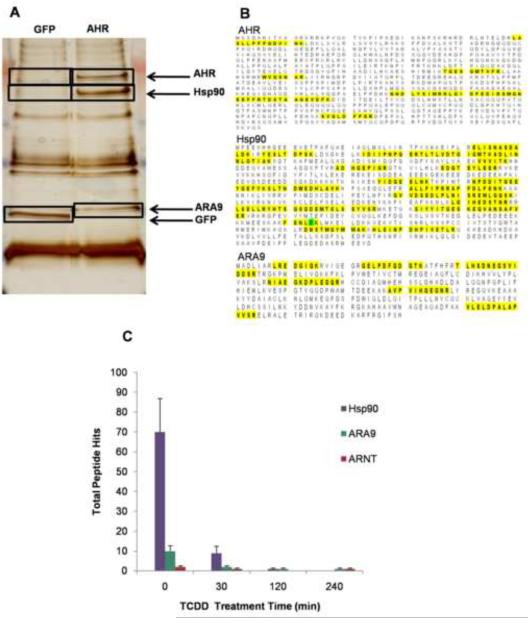
Figure 2.
Silver stain gel of TAP samples. TAP final elute samples of AHR-TAP and GFP-TAP Hepa1c1c7 were separated on a 4–12% gradient SDS-Page gel and visualized using silver stain (A). Gel slices (black boxes) were analyzed as described in materials and methods. (B) MS identification of AHR and cytosolic complex proteins Hsp90 and ARA9. Highlighted regions show identified peptide sequences. All were identified at a >95% confidence using the ProteinProfit algorithm. (C) Total numbers of peptides identified by mass spectrometry of known interactors following TAP of the AHR.

