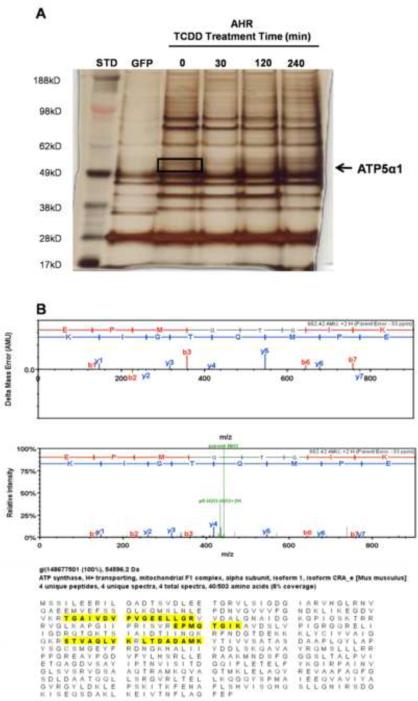
Figure 3.
Silver stained gel of TCDD time course experiment, lanes represent GFP-TAP, AHR-TAP (no dose, 30, 120, 240 min) 10nM TCDD exposure. Black box denotes gel slice from which ATP5α1 was only one of the identified proteins (A). ATP5α1 mass spectrometry data following AHR TAP, including error probability, signal intensity measurements and peptide sequence coverage (highlighted) aligned to the protein sequence (B).

