
Figure 6.
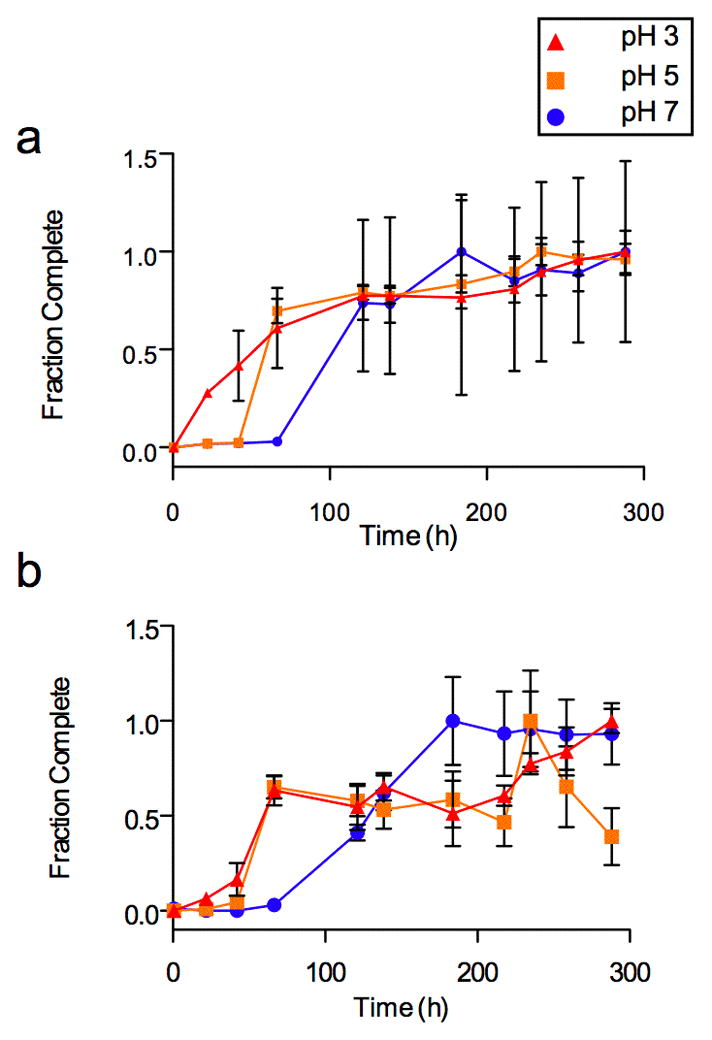
pH dependence of the GAG effect on fibril formation
Fibril formation is shown by the increase in ThT fluorescence (normalized) versus time in hours. Heparan sulfate was present at a concentration of 0.1mg/mL. a) AL-09 fibril nucleation in the presence of heparan sulfate, pH 3–7. b) AL-103 fibril nucleation in the presence of heparan sulfate, pH 3–7.