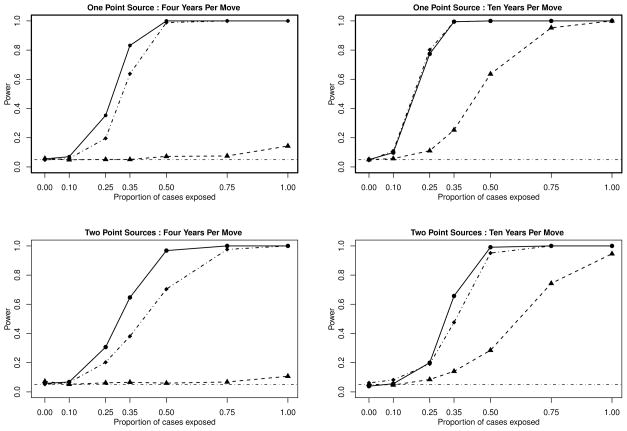
Figure 1.
Power curves for simulations of 100 cases and 100 controls on the unit square. Top left and top right assume a single point-source. Bottom left and bottom right assume two point-sources. Top left and bottom left assume an average residential duration of 4 years. Top right and bottom right assume an average residential duration of 10 years. These plots present the power curves for the M-statistic using the incubation based weighting system (–●–) compared to the M-statistic with uniform weights (–·◆–·)and the M-statistic using just the address at diagnosis (–▲–).

