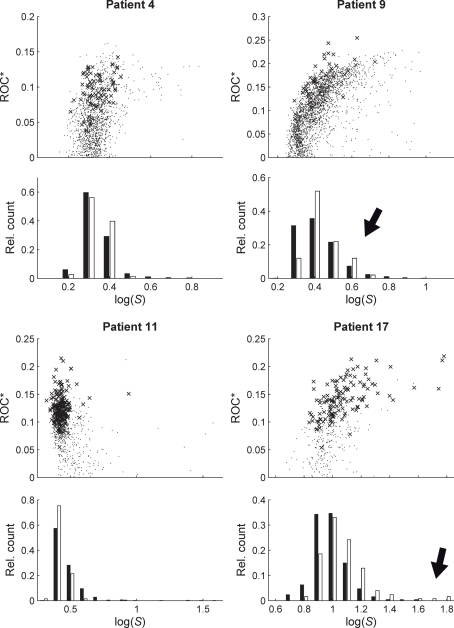
Figure 3.
Relationship between predictive performance ROC* and variance ratio S for four exemplary patients. Upper parts of plots show ROC* values for all measure profiles (time-dependent mean phase coherence from all possible combinations of electrode contacts) depending on S. Crosses indicate profiles with a significant predictive performance, i.e., exceeding maximum performance obtained from 19 realizations of STS. Lower parts of plots show relative frequency histograms of the distributions of profiles with significant (empty bars) and non-significant (black bars) prediction performance. For patient nos. 9 and 17, high values of S can be observed for profiles with a significant predictive performance (marked by black arrows).

