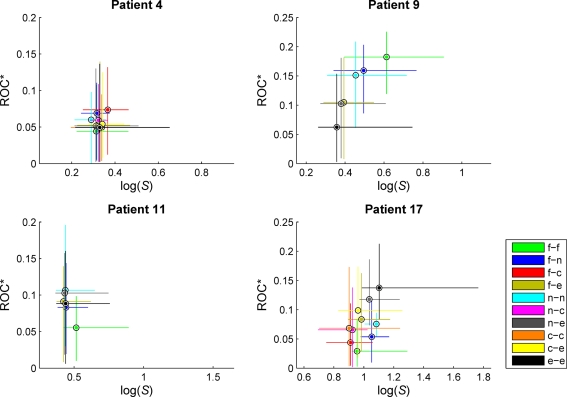
Figure 4.
Exemplary scatterplots of medians and 95% quantiles of the distributions of predictive performance ROC* and ratio of variances S for measure profiles derived from the different categories of combinations of recordings sites. f, Focal; n, neighboring; e, extra-focal; c, contralateral (in case of bilaterally implanted electrodes). Same patients as in Figure 3. For patient no. 9, high values of S could be observed for measure profiles characterizing interactions within the seizure onset zone (f/f). For patient no. 17, interactions between extra-focal brain regions (e/e) yielded high values of S, also carrying the most predictive information. No clear distinctions could be made for patient nos. 4 and 11.

