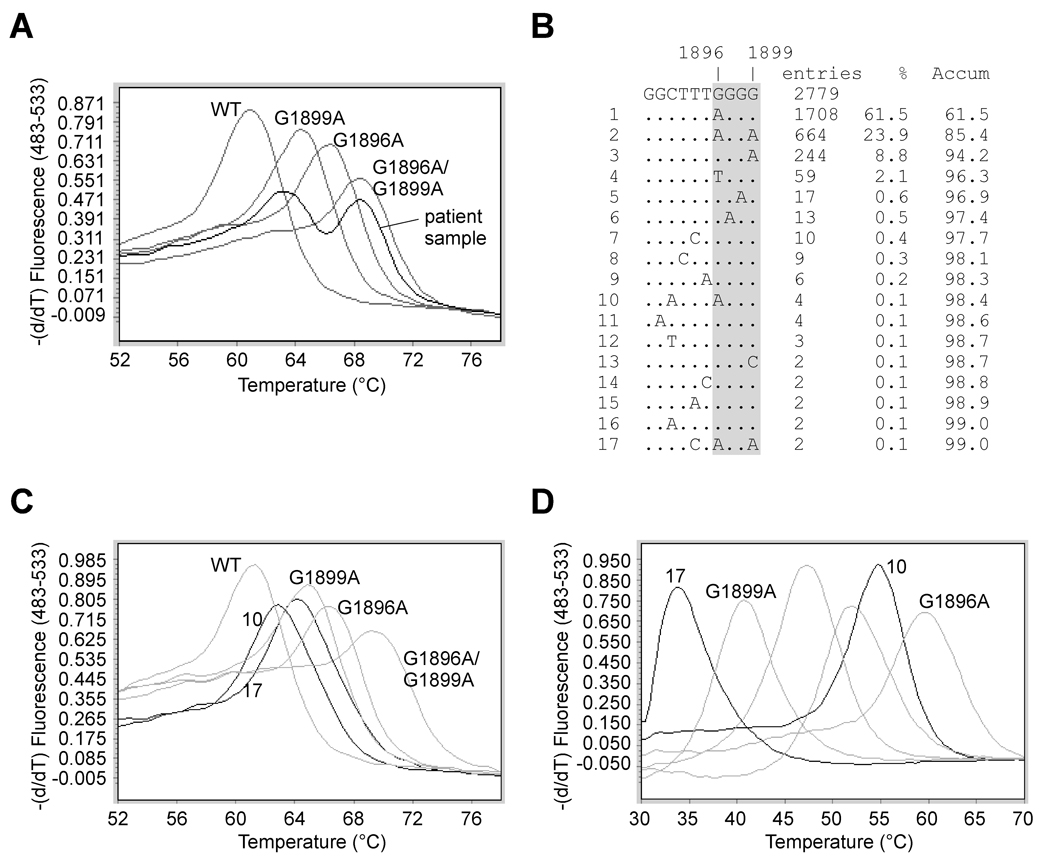
Figure 5. Reduced probe effective length increases probe performance.
(A) An example of melting curve analysis in a patient sample showing a mixture of G1899A and G1896A/G1899A. (B) A non-contiguous megablast analysis of HBV nucleotide 1890–1899 sequence patterns. Patterns were sorted according to their total number of entries in GenBank, together with their percentage and accumulative percentage. Sequences identical to the top consensus sequence were not listed. Patterns 10 and 17 were analyzed using SPC1 (C) and SPC2 (D) probes.

