Figure 2.
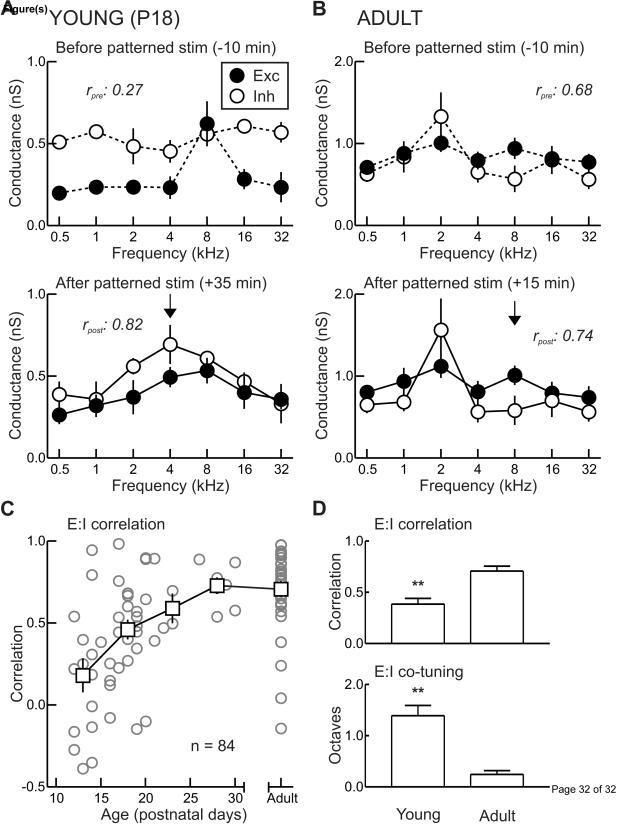
Development and plasticity of rat AI excitatory and inhibitory frequency tuning curves. A, In vivo whole-cell voltage-clamp recording from young (P18) AI neuron. Tone-evoked currents at different holding potentials were used to compute synaptic conductances. Top, before patterned stimulation, excitatory-inhibitory correlation is low (rpre: 0.27). Correlation (r) is the correlation coefficient of the linear fit to the mean values of excitation and inhibition across each of the seven tone frequencies used to measure synaptic tuning curves. Excitation indicated by filled symbols, inhibition indicated by open symbols. Bottom, synaptic frequency tuning in the same cell ~35 minutes after patterned stimulation with 4 kHz tones (arrow). Excitation and inhibition are both potentiated at 4 kHz, and the original best frequencies are depressed. Consequentially, excitatory-inhibitory correlation improves (rpost: 0.82). B, Recording from adult AI neuron. Top, before patterned stimulation, excitation and inhibition are balanced (rpre: 0.68). Bottom, patterned stimulation with 8 kHz tones has no lasting effect on synaptic strength or excitatory-inhibitory balance (rpost: 0.74). C, Correlation between excitatory and inhibitory frequency tuning profiles for all cells recorded between P12-P30 and from adults. Circles, individual recordings. Squares, averages at five day intervals. D, Comparison of developmental changes to synaptic frequency tuning between P12-P21 animals (‘Young’) and animals aged two months or older (‘Adult’). Top, excitatory-inhibitory balance (average linear correlation coefficient r). Bottom, co-tuning of best frequencies, in terms of the spectral difference (in octaves) between the best frequencies of excitation and inhibition. Adapted from Dorrn et al., 2010.

