Fig. 2.
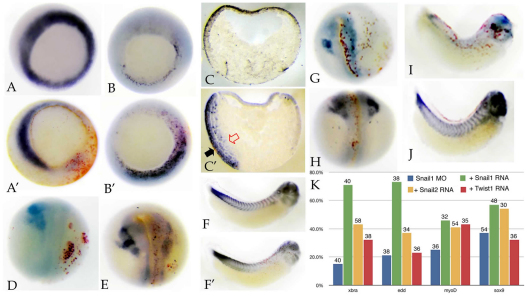
snail1 MO effects on germ layer markers. (A-B′) snail1 MO injection (into one cell of a 2-cell embryo) led to the loss of expression (as measured by in situ hybridization) of xbra (A′, versus control in A) and to an increase in endodermin (edd) (B′, versus control in B) RNA levels (at stage 11). (C,C′) Section analysis revealed that the edd expression domain, which is restricted to the superficial region in control embryos (C), extends deeper into the mesodermal region in snail1 MO-injected embryos (C′, black arrow indicates lacZ marker staining, and the red arrow indicates the extent of edd staining in deep mesodermal tissue). (D-F′) There was a loss of expression of the neural crest/placodal marker sox9 at stage 17/18 (D, severely affected; E, mildly affected; injected sides to the right), as well as a loss of expression of myoD at stage 25, as expressed in myotomal muscle, a mesodermal derivative (F′, versus control in F). (G-J) The effects on sox9 (G,H) and myoD (I,J) of snail1 MO injection (G,I) were rescued by the injection of the Snail1-GFP RNA (H,J), which lacks the snail1 MO target sequence. Injected sides are shown. (K) The percentage of normal embryos plotted with respect to xbra, edd, myoD and sox9 in situ expression. Blue, snail1 MO injected; green, snail1 MO together with snail1 RNA (600 pg/embryo); yellow, snail1 MO together with Snail2-GFP RNA (600 pg/embryo); red, snail1 MO together with Twist1-GFP RNA (600 pg/embryo). The number of embryos examined is indicated above each bar.

