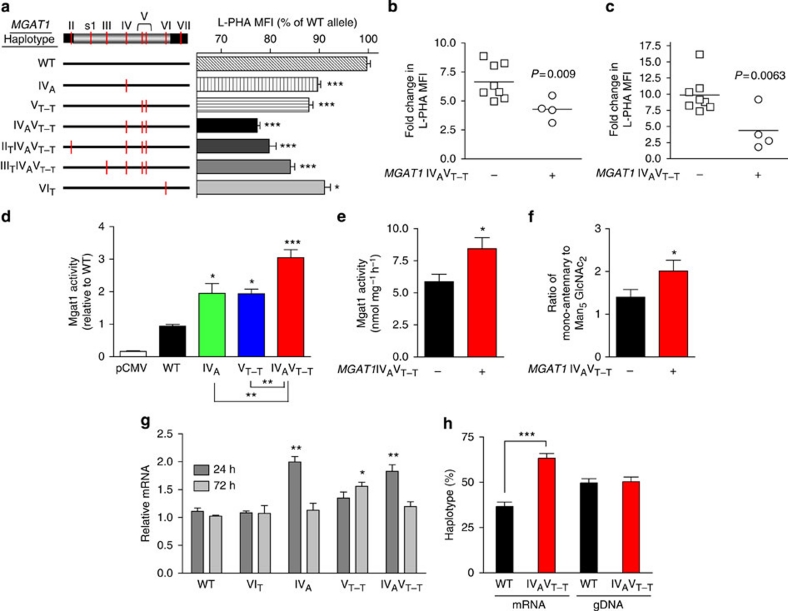
Figure 3. MGAT1 haplotypes reduce N-glycan branching.
(a) MGAT1 exon 2 was amplified by PCR from genomic DNA, cloned into the pCMV vector, sequenced to identify haplotypes, transiently transfected into Mgat1-deficient CHO cells (Lec1) in triplicate and analysed 3 days later by L-PHA fluorescence-activated cell sorting. MFI was determined on the L-PHA+ population and normalized to the common haplotype (WT). (b) Anti-CD3 or (c) myelin peptide was used to stimulate PBMCs from healthy human controls for 48 h. Fold increase in L-PHA MFI in CD4+ T cells following stimulation was determined by comparing unstimulated resting cells with blasting cells in each subject. All subjects had ≥3 IL2RA*T+IL7RA*C risk alleles, except one subject in each group heterozygous for both. (d) Mgat1-deficient Lec1 cells were transiently transfected with the indicated MGAT1 haplotypes and lysed to assess Mgat1 enzyme activity. Average Mgat1 activity for WT (common haplotype) was 6.45 nmol mg−1 h−1. Activities were normalized for transfection efficiency. (e) Human PBMCs with the indicated genotypes (n=4 per genotype) were lysed to assess Mgat1 enzyme activity as in d. Subjects had ≥3 IL2RA*T+IL7RA*C risk alleles. (f) N-Glycans in human PBMCs with the indicated genotypes (n=6 per genotype) were analysed by matrix-assisted laser desorption/ionization–time of flight mass spectroscopy and normalized by taking the ratio of the intensity of mono-antennary ((Gal)GlcNAc1Man5GlcNAc2) to Man5GlcNAc2, the product and acceptor of Mgat1, respectively. Subjects had ≥3 IL2RA*T+IL7RA*C risk alleles except for two MGAT1 IVAVT−T subjects that were double heterozygotes; removal of which does not alter the result (that is, 2.01 versus 1.97). (g) Lec1 cells transfected with the indicated MGAT1 haplotypes were analysed for relative mRNA levels by quantitative reverse transcription PCR. Expression was normalized for transfection efficiency. (h) Human PBMCs from two heterozygous MGAT1 IVAVT−T subjects were examined for differential allelic expression by comparing the relative abundance of mRNA and genomic DNA (gDNA) for each haplotype in vivo. P values in b, c, e, f and h by t-test and panels a, d and g by analysis of variance and the Newman–Keuls Multiple Comparison Test. *P<0.05, **P<0.01, ***P<0.001 in all panels. Error bars are standard error of triplicate or greater values in all panels.

