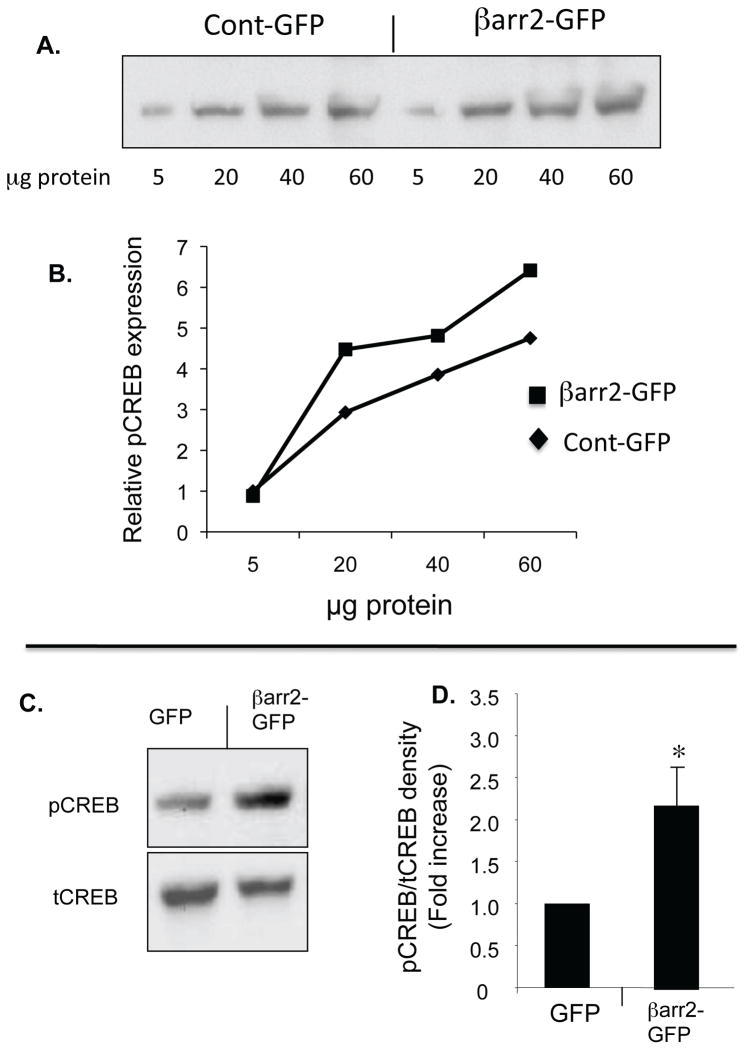
Figure 3. Expression of pCREB and tCREB in unstimulated βarr2-GFP expressing cells and control GFP expressing cells.
A) Representative gel and associated densitometry (B) showing increased pCREB content in βarr2-GFP cells compared to control-GFP cells over a range of protein concentrations. C) Representative gel showing pCREB and tCREB expression in control-GFP cells and βarr2-GFP cells. D) Densitometry analysis of pCREB/tCREB ratios using 30 μg protein. Data normalized to control-GFP cells and reported as fold increase. Error bars represent SEM with n=9 for each. Significance determined by t-test, *p<0.05.

