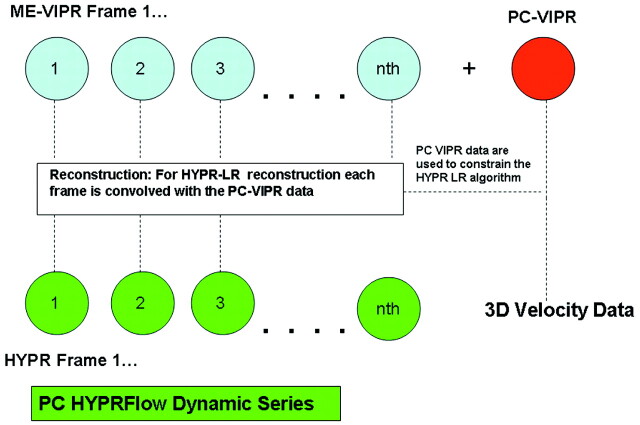
Fig 1.
Flow chart of PC HYPRFlow. First a series of low-resolution CE source images is acquired, followed by a high-resolution velocity-encoded PC acquisition. Then the low-resolution source images are convolved with the high-resolution PC image by using HYPR-LR, resulting in a time series of high-resolution HYPR images.

