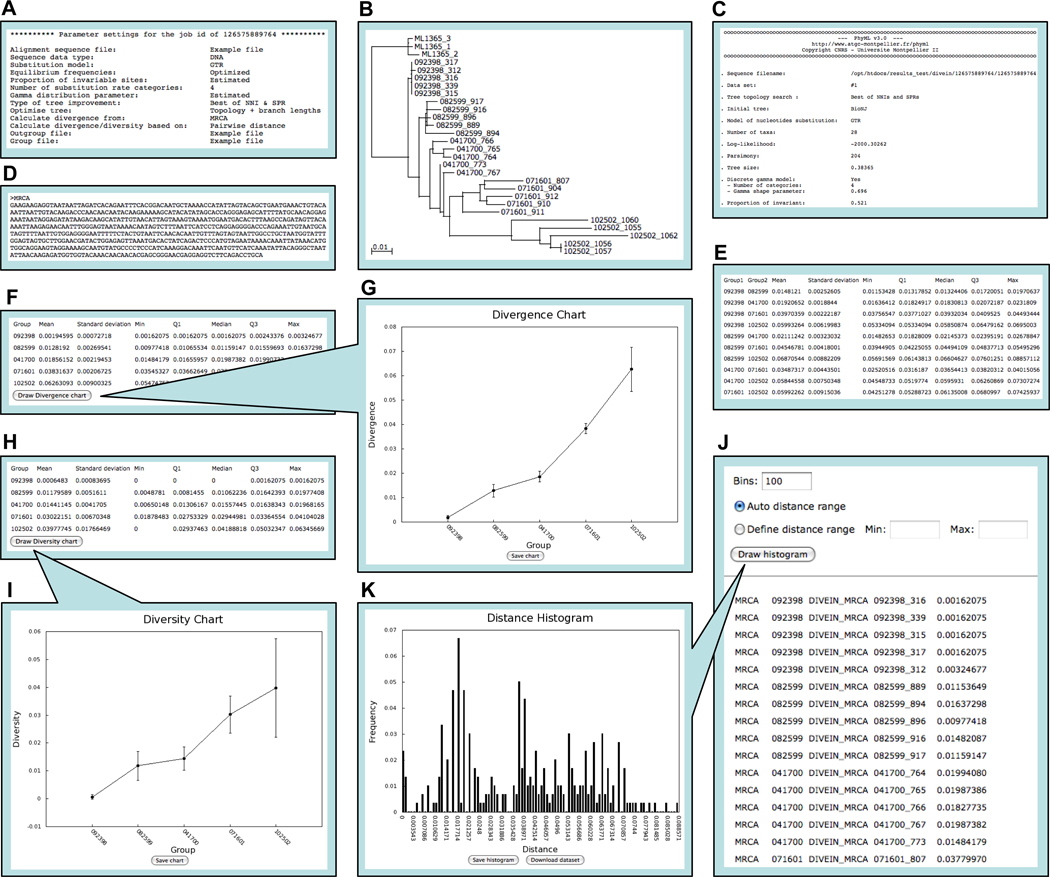
Figure 1.
Screen shots of phylogeny/divergence/diversity output in DIVEIN. (A) Parameter settings for running the program. (B) Phylogenetic tree viewed through the Archaeopteryx Java applet. (C) Estimated evolutionary parameters. (D) Reconstructed MRCA sequence. (E) Summarized distances between groups. (F) Summarized divergence from MRCA for each group. (G) Divergence plot generated by clicking the Draw divergence chart button. (H) Summarized diversity for each group. (I) Diversity plot generated by clicking the Draw diversity chart button. (J) Distance matrix. (K) Distance distribution histogram generated by clicking the Draw histogram button.

