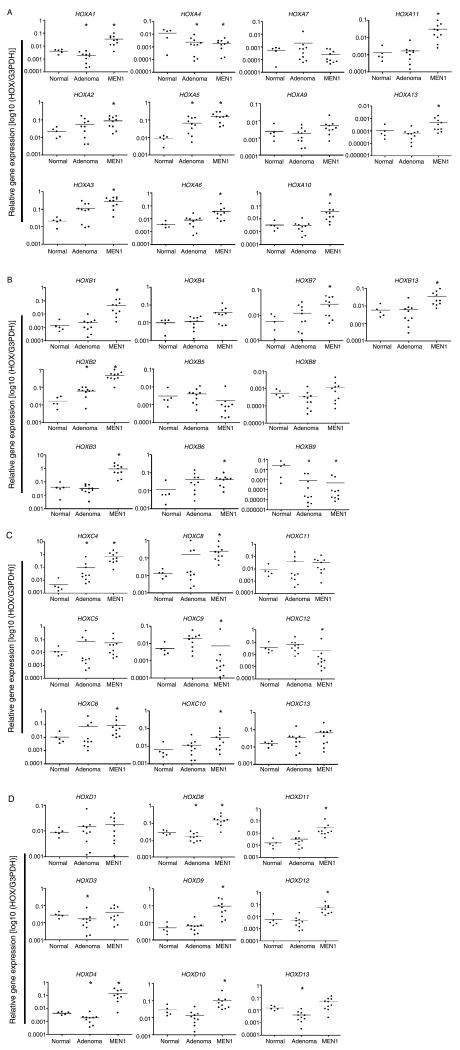
Figure 1.
Quantitative real-time PCR analysis of (A) HOXA cluster, (B) HOXB cluster, (C) HOXC cluster, and (D) HOXD cluster. Relative mRNA expression of 39 HOX genes in 10 familial MEN1 parathyroid tumors, 10 sporadic parathyroid adenomas, and 5 normal parathyroids. Each circle indicates an individual parathyroid sample, and horizontal bars represent the gene expression average within each diagnosis group (x-axis). A P value of < 0.05 was considered statistically significant, and indicated by the asterisk. The y-axis represents relative expression ratio of target HOX gene to internal reference gene (G3PDH).

