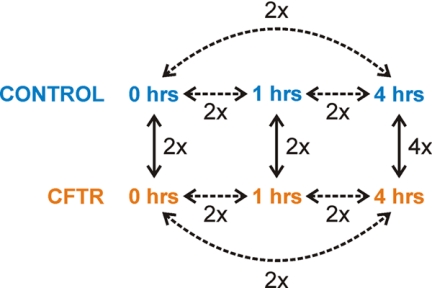
Fig. 3.
Schematic representation of a Master pool and an outline of the meaningful comparisons of the relative protein abundances. Each Master pool contained peptide samples representing three time points of the control strain and three time points of the CFTR-expression strain (0 h, 1 h, 4 h after induction expression). The expression levels of proteins could be followed as function of the time within the control and CFTR-expression strains (dashed lines). Furthermore, the relative changes in protein abundance could also be calculated between the control and the CFTR-expression strains at three of the time points (solid lines). All the comparisons were based on two independent biological replicates (Fig. 2), indicated by 2×. However, the comparison between the CFTR expressing strain and the control strain at the 4 h time point was repeated two more times in order to obtain four replicate values (4x).

