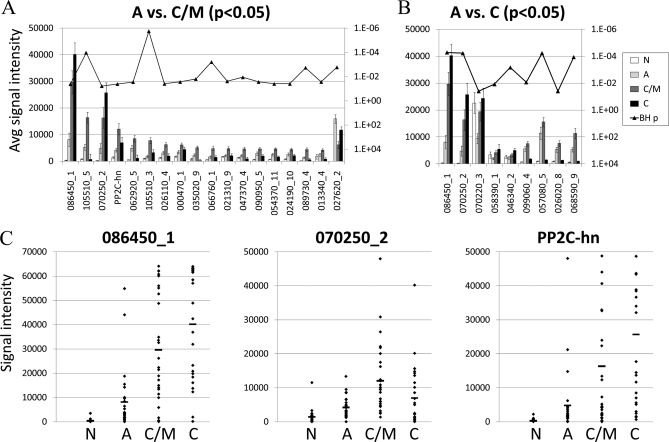
Fig. 4.
Candidate IgG serodiagnostic antigens defined by microarray. IgG profiles of acute and chronic/IgM persisting populations were compared using t-tests. Specific responses that are low in acute and high in chronic/IgM persisting and chronic may have serodiagnostic use. A, Eighteen significant antigens were identified by comparison between acute and chronic/IgM persisting populations. Shown in the histogram are the average signal intensities for each of the four patient populations for these 18 antigens, ranked by descending response of the IgM persisting population. 027620_2 reacted significantly higher in acute than IgM persisting groups. p values with Benjamini-Hochberg correction are overlaid (right-hand axis). B, Nine significant antigens were identified by comparison between acute and chronic populations. Shown in the histogram are the average signal intensities for each of the four patient populations for these nine antigens, ranked by descending response of the chronic population. p values with Benjamini-Hochberg correction are overlaid (right-hand axis). C, Dot plots of responses of individual donors to the 086540_1, PP2C-hn, and 070250_2 antigens. Each spot represents the signal intensity of a single serum sample. Horizontal bars in each population represent the mean. N, negative; A, acute; C/M, chronic/IgM persisiting; C, chronic.

