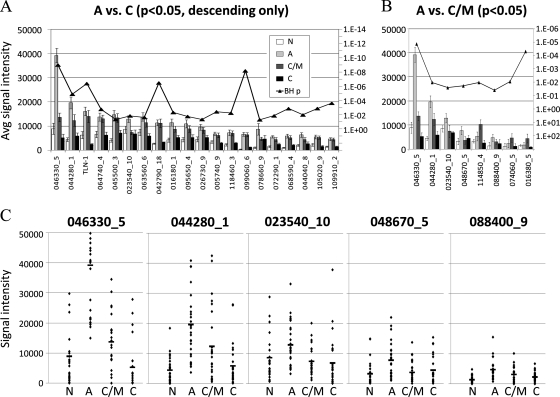
Fig. 7.
Candidate IgM serodiagnostic antigens defined by microarray. IgM profiles of acute and chronic/IgM persisting populations were compared using t-tests. Specific responses that are high in acute and low in chronic/IgM persisting and chronic stages may have serodiagnostic use. A, Ninety-one significant antigens were identified by comparison between acute and chronic populations. Shown in the histogram are the average signal intensities for each of the four patient populations for these antigens, ranked by descending response of the acute population. p values with Benjamini-Hochberg correction are overlaid (right-hand axis). B, Eight significant antigens were identified by comparison between acute and IgM persisting populations. Shown in the histogram are the average signal intensities for each of the four patient populations for these eight antigens, ranked by descending response of the acute population. p values with Benjamini-Hochberg correction are overlaid (right-hand axis). (C) Dot plots of responses of individual donors to the 046330_5, 044280_1, 023540_10, 048670_5, and 088400_9 antigens. Each spot represent the signal intensity of a single serum sample. Horizontal bars in each population represent the mean. N, negative; A, acute; C/M, chronic/IgM persisiting; C, chronic.

