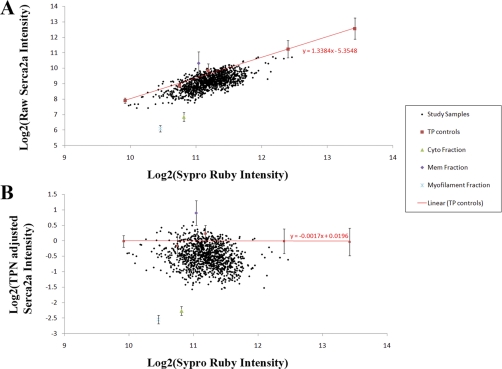
Fig. 2.
Total protein normalization. A, The primary intensity plotted versus the sypro ruby intensity. The red line is the fit total protein dependence using the total protein controls, slope = 1.34. B, A plot of the TPN adjusted intensity versus the same sypro ruby intensity, total protein control slope = –0.0017.

