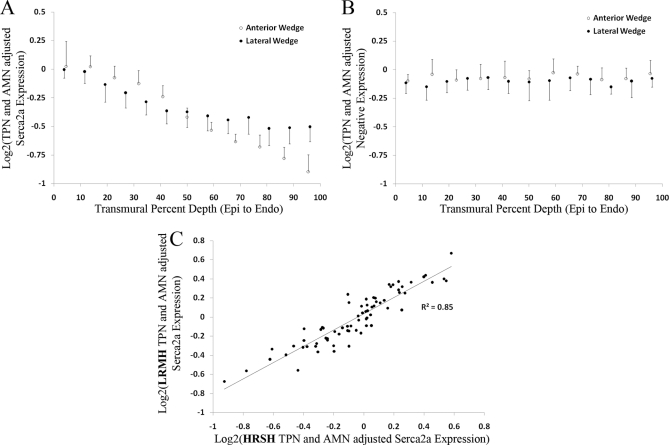
Fig. 5.
HRSH RPMA results and correlation to LRMH RPMAs. A, Serca2a expression of a single DHF heart (lateral wedge shown as black open triangle in Fig. 3) at full 1-mm resolution. B, Negative stain transmural expression of an identical HRSH RPMA from the same printing run. C, Scatter plot of serca2a expression for samples that were on the LRMH array and the twelve HRSH arrays (R2 = 0.85).

