Figure 4.
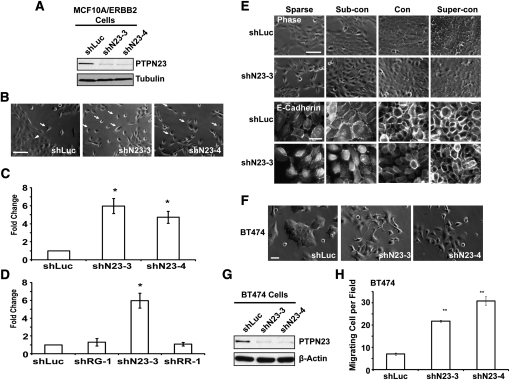
Mammary epithelial cell scattering and impaired cell–cell adhesion induced by suppression of PTPN23. (A) Immunoblot to demonstrate shRNA-induced suppression of the expression of PTPN23 protein. The expression of α-tubulin was used as the loading control. (B) Suppression of PTPN23 induced MCF10A/ERBB2 cell scattering. The photographs illustrate the morphology of the MCF10A/ErbB2 cells that expressed the indicated shRNA in subconfluent culture. Arrows indicate cell scattering. Arrowhead indicates cell cluster. Bar, 100 μm. (C) Cell scattering was quantitated by counting the number of single cells per field. At least five random fields were measured in each condition. Data are presented as change in cell scattering relative to shLuc control. Error bars represent SEM (n = 3); (*) P < 0.05. (D) RNAi-induced suppression of PTPN23, but not PTPRG or PTPRR, induced cell scattering. Cell scattering was quantitated as in C. Error bars represent SEM (n = 3); (*) P < 0.05. (E) Suppression of PTPN23 delayed the formation of adherens junctions. Images are phase (top panels) or immunofluorescence staining of E-cadherin (bottom panels) of MCF10A/ERBB2 cells. Bars, 100 μm or 20 μm, respectively. (F) Morphology of the BT474 cells that expressed the indicated shRNA. Bar, 50 μm. (G) Suppression of PTPN23 protein expression by shRNA in BT474 cells. The expression of β-actin was used as the loading control. (H) Quantitation of cell motility induced by PTPN23-directed shRNA in BT474 cells. Data are presented as the number of migrating cells per field. Error bars represent SEM (n = 3); (**) P < 0.01.

