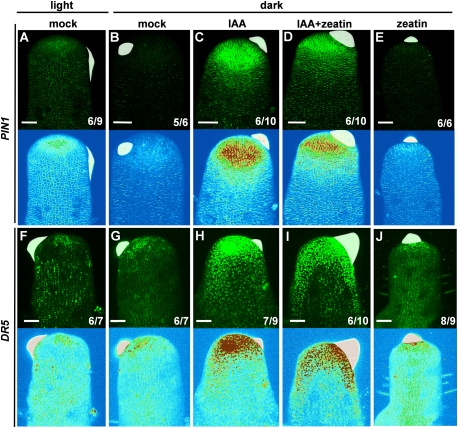
Figure 4.
Induction of auxin signaling by local auxin and cytokinin treatment on tomato NPA pins. Maximal projections of transversal confocal sections of NPA pins expressing PIN1-GFP (A–E) and DR5-YFP (F–J). Confocal image with GFP signal in green (top) and GEO look-up tables (bottom). In GEO look-up tables, blue indicates low intensity, and red indicates high intensity. Microapplication of 1% DMSO lanolin to the flank of a light-cultured NPA pin (A,F), 1% DMSO lanolin to the flank of a dark-cultured NPA pin (B,G), 10 mM IAA lanolin to the flank of a dark-cultured NPA pin (C,H), 10 mM IAA plus 1 mM zeatin lanolin to the flank of a dark-cultured NPA pin (D,I), and 1 mM zeatin lanolin to the summit of the meristem of a dark-cultured NPA pin (E,J). The numbers in the bottom right corner show the number of apices that display the shown expression pattern out of the total number of samples. Bars, 50 μm. Lanolin pastes are colored white.

