Figure 5.
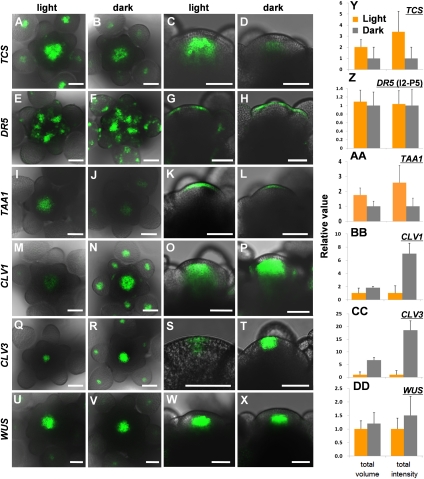
Darkness affects the expression of stem cell marker genes. Expression of TCS-GFP in the light (A,C) and the dark (B,D), DR5-GFP in the light (E,G) and the dark (F,H), TAA1-GFP in the light (I,K) and the dark (J,L), CLV1-GFP in the light (M,O) and the dark (N,P), CLV3-GFP in the light (Q,S) and the dark (R,T), and WUS-GFP in the light (U,W) and the dark (V,X) in inflorescence meristem in wild-type Arabidopsis plants. Maximal projections of transversal confocal sections (A,B,E,F,I,J,M,N,Q,R,U,V) and longitudinal confocal sections (C,D,G,H,K,L,O,P,S,T,W,X). Bars, 50 μm. (Y–DD) Total volume and total intensity of GFP-expressing regions are quantified (n > 10) in each condition. For DR5-GFP, expression in I2–P5 primordia was quantified. For other genes, expression in the central zone was quantified. When parametric statistics assumptions were met (normality and homogeneity of variances), a t-test was performed. In the remaining samples, a nonparametric test (Mann-Whitney's U-test) was performed. P-values are in parentheses; P < 0.05 was considered to be significant. The volume of TCS (P < 0.001), CLV3 (P < 0.001), CLV1 (P = 0.023), WUS (P = 0.211), DR5 (P = 0.684), and TAA1(P < 0.001) and the intensity of TCS (P < 0.001), CLV3 (P < 0.001), CLV1 (P < 0.001), WUS (P = 0.117), DR5 (P = 0.796), and TAA1 (P < 0.001). Therefore, there are significant differences in TCS, TAA1, CLV1, and CLV3 expression but no significant differences in WUS and DR5 expression between the light and the dark.

