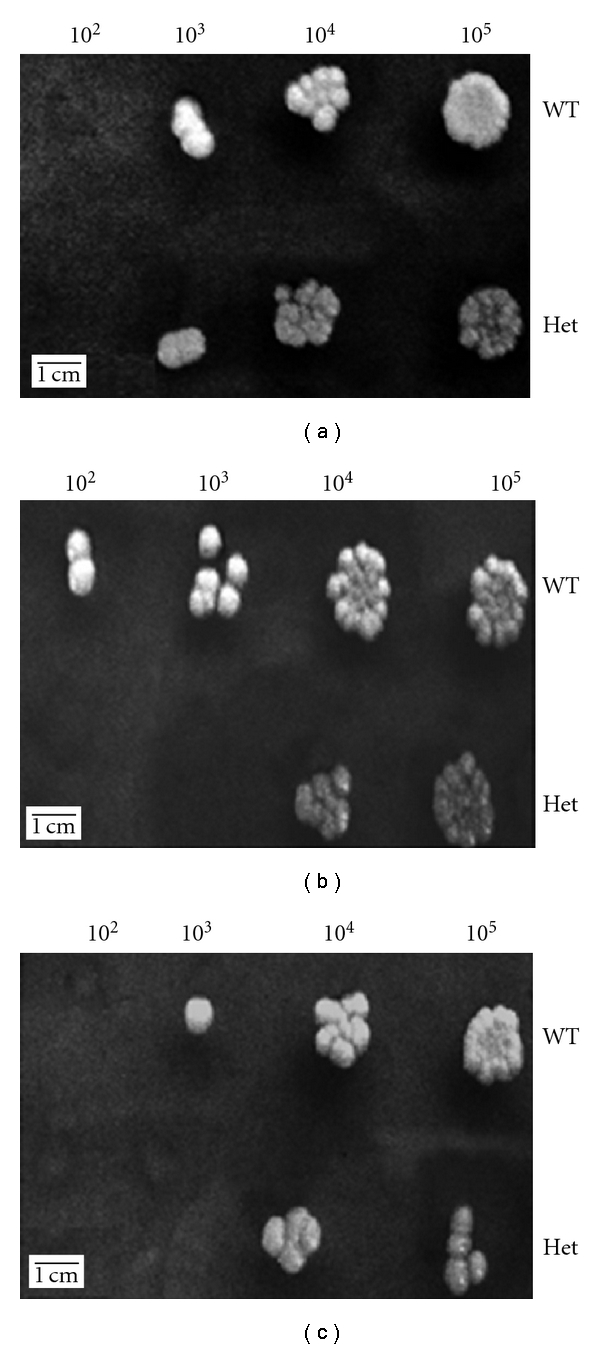
Figure 6.

Oxidative stress assay. (a) Control plate; (b) 10 mM concentration of H2O2; (c) 25 mM concentration of H2O2. Strains were grown in PDB, then diluted (105 to 102 cells/mL), and incubated with different doses of hydrogen peroxide for one hour. 5 μL of the treated culture was spotted on PDA plates. Untreated cultures were also spotted as controls. Note the increased susceptibility of the mutant to hydrogen peroxide.
