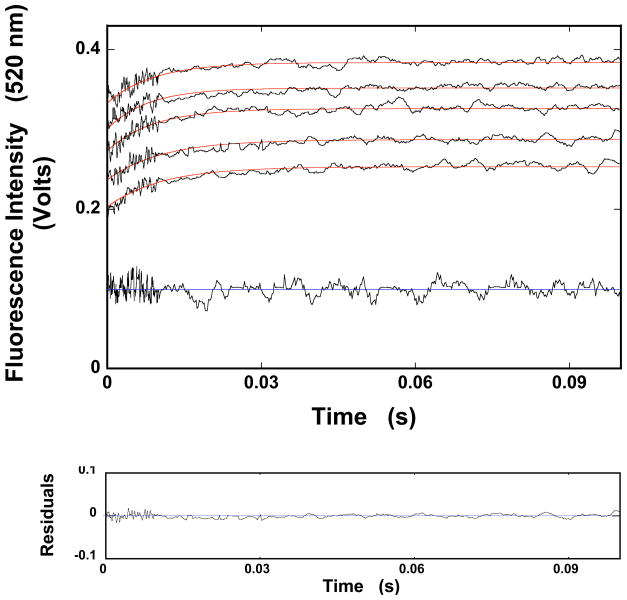
Figure 1.
a. The fluorescence stopped-flow kinetic traces after mixing the ssDNA 10-mer, dεA(pεA)9, with the ASFV pol X in buffer C (pH 7.0, 10°C) (λex = 325 nm, λem = 410 nm). The final concentration of the 10-mer is 2 × 10⁻⁷ M (oligomer). The traces were recorded at two time bases, 10 and 100 ms. The concentrations of the polymerase are: 4 × 10⁻⁷ M, 6 × 10⁻⁷ M, 8 × 10⁻⁷ M, 1 × 10⁻⁶ M, and 1.2 × 10⁻⁶ M. The solid red lines are the single-exponential, nonlinear leastsquares fits of the experimental curves using eq. 1. The low horizontal trace is the nucleic acid mixed with the buffer alone with the blue line indicating the average value of the signal. The lower panel shows the deviations of the experimental curve, recorded at [ASFV pol X]T = 6 × 10⁻⁷ M, from the fit.

