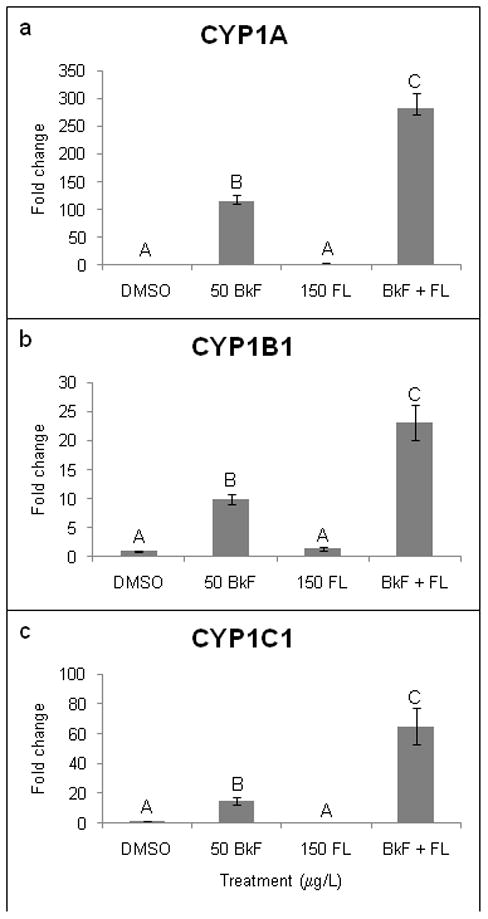
Figure 2.

Effect of PAHs on CYP1 mRNA expression. Embryos were dosed at 24 hpf, and expression was measured at 48 hpf. (a) CYP1A; (b) CYP1B1; (c) CYP1C1. Expression is shown as fold induction compared to DMSO controls. n = 9–12 per treatment; each n represents 10 pooled embryos. Groups not sharing a common letter are significantly different (p ≤0.05; ANOVA, Tukey adjusted LSMeans).
